42 Project Management Tools
Ellen Mathein
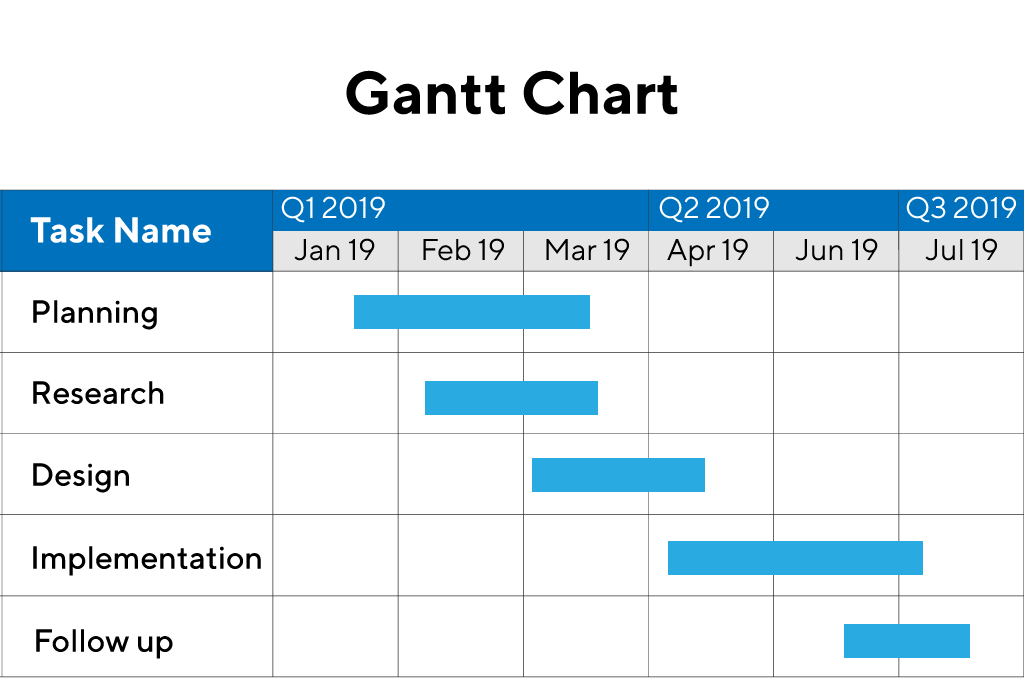
The Gantt Chart
Gantt charts have become a common technique for representing the phases and activities of a project work breakdown structure, as they can be understood by a wide audience.
A Gantt chart is a type of bar chart that illustrates a project schedule. Gantt charts illustrate the start and finish dates of each task, as well as task dependencies and links. Gantt charts can be easily customized to show resources, costs, and other important information. They can also be color-coded for different task phases or responsibilities.
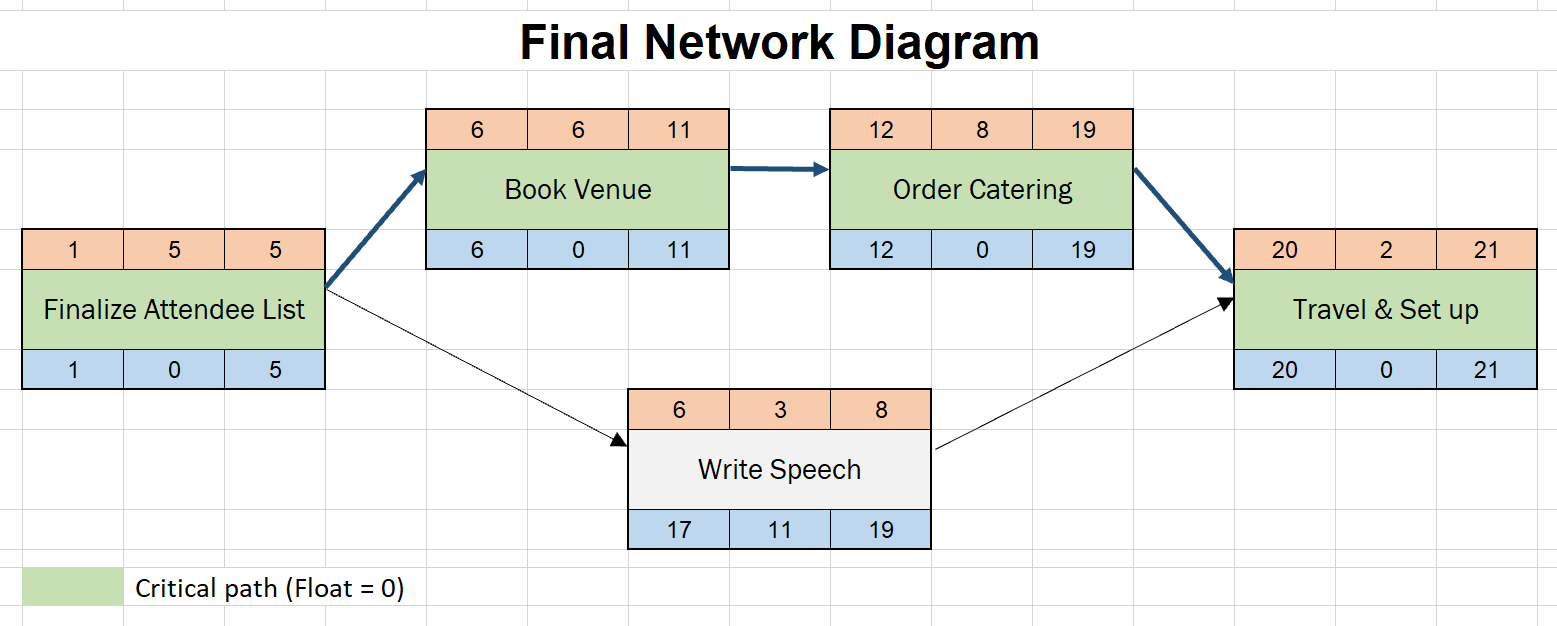
The Network Diagram
A network diagram is another way of showing the path of tasks in the project. Tasks are each placed in a box and each box is placed in chronological order. Arrows are drawn from task to task, indicating the logical progression of work. Boxes can be customized to contain any information you like, including start and finish dates, task length, cost, resources, and more. Boxes can also be color-coded based on the phase of the project; resource required, team assignment, etc.
We recommend building the network diagram as a team using these steps.
- Write all steps out on sticky notes.
- Tape a large piece of paper to the wall.
- Place sticky notes in order.
- Once you think you have the right order, check to make sure lag and lead time is allowed for. Also look for ways that work can be completed simultaneously.
- Draw arrows to indicate task links. Color-code the boxes if desired.
- Post the diagram in a central location. Make a copy for reference, and keep the original drawing updated as the project progresses.
The network diagram will also help you identify the critical path: the shortest path through the project. This will help if an element of the triple constraint changes and you must alter your plan.
Using a RACI Chart
A RACI chart is an excellent way to outline who is responsible for what during the project. To start, create a chart with tasks listed on the left hand side, and resources listed across the top. Now, put the appropriate letter in each cell:
- R: Responsible for execution
- A: Approver
- C: Consult
- I: Keep informed
| Example
|
Sue | Bob | Joe | Jane |
| Build widget plan | A | R | I | I |
| Build widget | R | A | C | I |
| Ship widget to customers | I | I | I | R |
Going the Extra Mile: Microsoft Project
Throughout the course, we have made some references to using computer software to manage projects. We have even included some diagrams from Microsoft Project, a popular project management application.
Applications like Microsoft Project are extremely useful for project managers and their teams. Microsoft Project, as an example, stores information about resources, schedules, tasks, budgets, and more; generates reports on the fly; allows you to enter and view information in numerous ways; and even allows you to collaborate with other team members.
We urge everyone, particularly new project managers, to remember that Microsoft Project is just a tool. In order to make the best use of it, you must understand how it calculates numbers and generates diagrams. Once you have a solid understanding of basic project management concepts, feel free to take the time to learn about project management software if you desire.
Remember, too, that every project requires different tools. For small projects, you may not need the sophisticated features of a software program. If you choose to grow your project management skills, however, and take on larger projects, you will appreciate the extra tools available in these applications.
