138 Chapter 11 Environmental Protection and Negative Externalities Answer Key
Chapter 11 Environmental Protection and Negative Externalities Answer Key
1.
- positive externality
- negative externality
- positive externality
- negative externality
- negative externality
2.
- supply shifts left
- supply shifts left
- supply stays the same
- supply shifts left
3.
- price will rise
- price will rise
- price stays the same
- price will rise.
4. The original equilibrium (before the external social cost of pollution is taken into account) is where the private supply curve crosses the demand curve. This original equilibrium is at a price of $15 and a quantity of 440. After taking into account the additional external cost of pollution, the production becomes more costly, and the supply curve shifts up. The new equilibrium will be at a price of $30 and a quantity of 410.
5. The first policy is command-and-control because it is a requirement that applies to all producers.
6.
- market-based
- command-and-control
- command-and-control
- market-based
- market-based
7. Even though state or local governments impose these taxes, a company has the flexibility to adopt technologies that will help it avoid the tax.
8. First, if each firm is required to reduce its garbage output by one-fourth, then Elm will reduce five tons at a cost of $5,500; Maple will reduce 10 tons at a cost of $13,500; Oak will reduce three tons at a cost of $22,500; and Cherry will reduce four tons at a cost of $18,000. Total cost of this approach: $59,500. If the system of marketable permits is put in place, and those permits shrink the weight of allowable garbage by one-quarter, then pollution must still be reduced by the same overall amount. However, now the reduction in pollution will take place where it is least expensive.
|
Reductions in Garbage |
Who does the reducing? |
At what cost? |
|
First 5 tons |
Cherry |
$3,000 |
|
Second 5 tons |
Cherry |
$4,000 |
|
Third 5 tons |
Cherry |
$5,000 |
|
Fourth 5 tons |
Elm |
$5,500 |
|
Fifth and sixth 5 tons |
Elm and Cherry |
$6,000 each |
|
Seventh 5 tons |
Maple |
$6,300 |
|
Eighth 5 tons |
Elm |
$6,500 |
|
Ninth and tenth 5 tons |
Elm and Cherry |
$7,000 each |
Thus, the overall pattern of reductions here will be that Elm reduces garbage by 20 tons and has 15 tons of permits to sell. Maple reduces by five tons and needs to buy five tons of permits. Oak does not reduce garbage at all, and needs to buy 15 tons of permits. Cherry reduces garbage by 25 tons, which leaves it with five tons of permits to sell. The total cost of these reductions would be $56,300, a definite reduction in costs from the $59,500 cost of the command-and-control option.
9.
|
|
Incentives to Go Beyond |
Flexibility about Where and How Pollution Will Be Reduced |
Political Process Creates Loopholes and Exceptions |
|
Pollution Charges |
If you keep reducing pollution you reduce your charge |
Reducing pollution by any method is fine |
If charge applies to all emissions of pollution then no loopholes |
|
Marketable Permits |
If you reduce your pollution you can sell your extra pollution permits |
Reductions of pollution will happen at firms where it is cheapest to do so, by the least expensive methods |
If all polluters are required to have permits then there are no loopholes |
|
Property Rights |
The party that has to pay for the pollution has incentive to do so in a cost effect way |
Reducing pollution by any method is fine |
If the property rights are clearly defined, then it is not legally possible to avoid cleanup |
10. See the answers in the following table. The marginal cost is calculated as the change in total cost divided by the change in quantity.
|
|
Total Cost (in thousands of dollars) [marginal cost] |
Total Benefits (in thousands of dollars) [marginal benefit] |
|
16 million gallons |
Current situation |
Current situation |
|
12 million gallons |
50 [50] |
800 [800] |
|
8 million gallons |
150 [100] |
1,300 [500] |
|
4 million gallons |
500 [350] |
1,850 [350] |
|
0 gallons |
1,200 [700] |
2,000 [150] |
The “optimal” level of pollution is where the marginal benefits of reducing it are equal to the marginal cost. This is at four million gallons.
Marginal analysis tells us if the marginal costs of cleanup are greater than the marginal benefit, society could use those resources more efficiently elsewhere in the economy.
11. See the next table for the answers, which were calculated using the traditional calculation of marginal cost equal to change in total cost divided by change in quantity.
|
Land Restored (in acres) |
Total Cost [marginal cost] |
Total Benefit [marginal benefit] |
|
0 |
$0 |
$0 |
|
100 |
$20 [0.2] |
$140 [1.4] |
|
200 |
$80 [0.6] |
$240 [1] |
|
300 |
$160 [0.8] |
$320 [0.8] |
|
400 |
$280 [1.2] |
$480 [0.6] |
The optimal amount of restored land is 300 acres. Beyond this quantity the marginal costs are greater than the marginal benefits.
12.
|
|
|
Country B |
|
|
|
|
Protect |
Not Protect |
|
Country A |
Protect |
Both A and B have a cost of 10 and a benefit of 16; each country has net = 6 |
A has a cost of 10 and a benefit of 8 (net = –2); B has a cost of 0 and a benefit of 8 ( net = 8) |
|
|
Not Protect |
A has a cost of 0 and a benefit of 8 (net = 8); B has a cost of 10 and a benefit of 8 (net = –2) |
Both A and B have a zero cost and a zero benefit; each country has net = 0 |
Country B will reason this way: If A protects the environment, then we will have benefits of 6 if we act to protect the environment, but 8 if we do not, so we will not protect it. If A is not protecting the environment, we will have losses of 2 if we protect, but have zero if we do not protect, so again, we will not protect it. Country A will reason in a similar manner. The result is that both countries choose to not protect, even though they will achieve the largest social benefits—a combined benefit of 12 for the two countries—if they both choose to protect. Environmental treaties can be viewed as a way for countries to try to extricate themselves from this situation.
13.
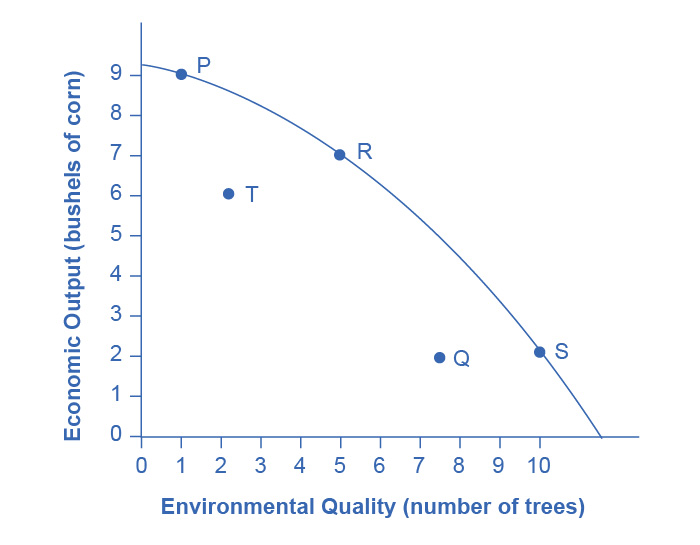
Of the choices provided, P, R, and S demonstrate productive efficiency. These are the choices on the production possibility frontier.
Allocative efficiency is determined by the preferences—in this case by the preferences of society as expressed through government and other social institutions. Because you do not have information about these preferences, you really cannot say much about allocative efficiency.
In the choice between T and R, R should clearly be preferred, because it has both more corn and more trees. This answer illustrates why productive efficiency is beneficial. Compared with choices inside the PPF, it means more of one or both goods.
In the choice between T and S, it is not possible to say which choice is better. True, S is on the PPF and T is not—but that only addresses the issue of productive efficiency. If a society has a strong preference for economic output and places a lower value on trees, then allocative efficiency may lead to a choice of T over S. Of course, the reverse could also be true, leading to a choice of S. Without information on society’s preferences to judge allocative efficiency, this question cannot be answered.
Compared with command-and-control policies, market-oriented policies allow either more output with the same environmental protection or more environmental protection with the same level of output—or more of both environmental protection and output. Thus, a choice like Q inside the PPF is more likely to represent a command-and-control policy demand than a choice like S on the frontier of the PPF.
Access for free at https://openstax.org/books/principles-economics-3e
