108 Fiscal Policy
Learning Objectives
- Introduce terms and goals
- Taxation
- Analyze recessionary and inflationary
- Define, Calculate, and Apply the Multiplier
- List and Discuss Automatic Stabilizers
- Assess Discretionary Fiscal Policy
- Discuss Fiscal Policy Lags
- Distinguish Between Budget Deficits and Surpluses and Debt
- Define and Differentiate Between Crowding Out and Crowding In
- Assess the Success of Fiscal Policy Measures in the Ending of the Great Recession
Definition/Goals of Macroeconomics
Goals: To have an economy with relatively low unemployment (measured by analyzing the unemployment rate), relatively stable price (measured by analyzing at CPI and Inflation rates), economic growth (measured by analyzing GDP)
Goals are accomplished by using the tools of Monetary and Fiscal Policies.
Taxation
Taxation
- Differentiate among a regressive tax, a proportional tax, and a progressive tax
- Identify major revenue sources for the U.S. federal budget
There are two main categories of taxes: those that the federal government collects and those that the state and local governments collect. What percentage the government collects and for what it uses that revenue varies greatly. The following sections will briefly explain the taxation system in the United States.
Taxes are paid by most, but not all, people who work. Even if you are part of the so-called “1099” or “gig” economy, you are considered an independent contractor and must pay taxes on the income you earn in those occupations. Taxes are also paid by consumers whenever they purchase goods and services. Taxes are used for all sorts of spending—from roads, to bridges, to schools (K–12 and public higher education), to police and other public safety functions. Taxes fund vital public services that support our communities.
Federal Taxes
Just as many Americans erroneously think that federal spending has grown considerably, many also believe that taxes have increased substantially. The top line of Figure 30.5 shows total federal taxes as a share of GDP since 1960. Although the line rises and falls, it typically remains within the range of 17% to 20% of GDP, except for 2009–2011, when taxes fell substantially below this level, due to the Great Recession.
Figure 30.5 Federal Taxes, 1960–2020 Federal tax revenues have been about 17–20% of GDP during most periods in recent decades. The primary sources of federal taxes are individual income taxes and the payroll taxes that finance Social Security and Medicare. Corporate income taxes and social insurance taxes provide smaller shares of revenue. (Source: Economic Report of the President, 2021. Table B-47, https://www.govinfo.gov/app/collection/erp/2021)
Figure 30.5 also shows the taxation patterns for the main categories that the federal government taxes: individual income taxes, corporate income taxes, and social insurance and retirement receipts. When most people think of federal government taxes, the first tax that comes to mind is the individual income tax that is due every year on April 15 (or the first business day after). The personal income tax is the largest single source of federal government revenue, but it still represents less than half of federal tax revenue.
The second largest source of federal revenue is the payroll tax (captured in social insurance and retirement receipts), which provides funds for Social Security and Medicare. Payroll taxes have increased steadily over time. Together, the personal income tax and the payroll tax accounted for over 85% of federal tax revenues in 2020. Although personal income tax revenues account for more total revenue than the payroll tax, nearly three-quarters of households pay more in payroll taxes than in income taxes.
The income tax is a progressive tax, which means that the tax rates increase as a household’s income increases. Taxes also vary with marital status, family size, and other factors. The marginal tax rates (the tax due on all yearly income) for a single taxpayer range from 10% to 35%, depending on income, as the following Clear It Up feature explains.
Clear It Up
How does the marginal rate work?
Suppose that a single taxpayer’s income is $35,000 per year. Also suppose that income from $0 to $9,075 is taxed at 10%, income from $9,075 to $36,900 is taxed at 15%, and, finally, income from $36,900 and beyond is taxed at 25%. Since this person earns $35,000, their marginal tax rate is 15%.
The key fact here is that the federal income tax is designed so that tax rates increase as income increases, up to a certain level. The payroll taxes that support Social Security and Medicare are designed in a different way. First, the payroll taxes for Social Security are imposed at a rate of 12.4% up to a certain wage limit, set at $137,700 in 2020. Medicare, on the other hand, pays for elderly healthcare, and is fixed at 2.9%, with no upper ceiling.
In both cases, the employer and the employee split the payroll taxes. An employee only sees 6.2% deducted from their paycheck for Social Security, and 1.45% from Medicare. However, as economists are quick to point out, the employer’s half of the taxes are probably passed along to the employees in the form of lower wages, so in reality, the worker pays all of the payroll taxes. If you are a member of the “gig economy” and receive a 1099 tax statement, then you are considered an independent contractor and so you must pay the employee and employer side of the payroll tax.
We also call the Medicare payroll tax a proportional tax; that is, a flat percentage of all wages earned. The Social Security payroll tax is proportional up to the wage limit, but above that level it becomes a regressive tax, meaning that people with higher incomes pay a smaller share of their income in tax.
The third-largest source of federal tax revenue, as Figure 30.5 shows is the corporate income tax. The common name for corporate income is “profits.” Over time, corporate income tax receipts have declined as a share of GDP, from about 4% in the 1960s to an average of 1% to 2% of GDP in the past 40 years.
The federal government has a few other, smaller sources of revenue. It imposes an excise tax—that is, a tax on a particular good—on gasoline, tobacco, and alcohol. As a share of GDP, the amount the government collects from these taxes has stayed nearly constant over time, from about 2% of GDP in the 1960s to roughly 3% by 2020, according to the nonpartisan Congressional Budget Office. The government also imposes an estate and gift tax on people who pass large amounts of assets to the next generation—either after death or during life in the form of gifts. These estate and gift taxes collected about 0.2% of GDP in 2020. By a quirk of legislation, the government repealed the estate and gift tax in 2010, but reinstated it in 2011. Other federal taxes, which are also relatively small in magnitude, include tariffs the government collects on imported goods and charges for inspections of goods entering the country.
State and Local Taxes
At the state and local level, taxes have been rising as a share of GDP over the last few decades to match the gradual rise in spending, as Figure 30.6 illustrates. The main revenue sources for state and local governments are sales taxes, property taxes, and revenue passed along from the federal government, but many state and local governments also levy personal and corporate income taxes, as well as impose a wide variety of fees and charges. The specific sources of tax revenue vary widely across state and local governments. Some states rely more on property taxes, some on sales taxes, some on income taxes, and some more on revenues from the federal government.
Definition/Goals of Fiscal Policy
Definition:
Fiscal policy is the manipulation of the federal budget to attain price stability, relatively full employment, and a satisfactory rate of economic growth.
Who Makes Fiscal Policy?
President the submits budget to Congress. So, the president with the help of Congress will decide together. Want to know more…. https://www.whitehouse.gov/omb/budget/
- Congress amends budget and passes individual appropriation bills
- Both House and Senate have to reconcile differences between their versions
- President can accept or veto
- If vetoed, Congress can try to override
- Fiscal Year begins October 1st
To obtain the macroeconomic goals, the president and Congress must manipulate its spending and taxes.
Remember: Monetary policy is a manipulation of the money supply the other type policy to help stabilize the economy. The Federal Reserve determines how much money should be circulating in our economy. The goals of monetary policy are price stability, relatively full employment, and a satisfactory rate of economic growth.
The goals of fiscal and monetary policy are the same for the US economy.
Perspective: History of Fiscal Policy
Until the Great Depression in the 1930s, the only advice economists gave the government was to try to balance its budget every year and not interfere with the workings of the private economy. There was no such thing as fiscal policy until John Maynard Keynes came around in the 1930s.
He pointed out there was a depression in 1929 and the problem was lack of aggregate demand. Consumption was lagging because so many people were out of work. Investment was extremely low because business owners had no reason to add to their inventories or build more plant and equipment. After all, sales were very low and much of their plant and equipment was sitting idle. Keynes lamented that the only thing left to do was boost aggregate demand or overall demand for the nation and the way to do that was to increase government spending. All the sectors of GDP (C+I+G+Xn) were suffering except the sector of government.
The government has two ways to help mediate recessions and inflations and that is through: spending and taxes.
Keynes suggested, in recessionary times, we would not want to raise taxes because that would most likely push aggregate demand even lower. We might even want to cut taxes to give consumers and businesses more money to spend. Where would the money come from if not taxes? John Maynard Keynes’ advice was if we ran a big enough budget deficit, we could jump start the economy and, in effect, spend our way out of the Great Depression. A budget deficit is a yearly number. This means that our government spends more than it collects in taxes for the year. Did John Maynard Keynes’ idea of fiscal policy work? Yes! We are no longer in the Great Depression.
Why Do We Use Fiscal Policy: Defining the Problem
Terms to Know
Let’s review some terms. Equilibrium GDP is the level of output at which aggregate demand equals aggregate supply. Aggregate demand is the sum of all expenditures for goods and services (that is, C+I+G+Xn). Aggregate supply is the nation’s total output of final goods and services. So, equilibrium GDP is, everything that is produced is sold.
Full Employment GDP. Full employment means nearly all of our resources (land, labor, capital) are being used. For example, if our plant and equipment is operating at between 85 and 90% of capacity, that’s full employment. Or if only 5% of our labor force is unemployed, then that’s full employment. Full employment GDP is the level of spending necessary to provide full employment of our resources. The imbalance creates a recessionary gap or an inflationary gap.
Recessionary Gap. A recessionary gap occurs when equilibrium GDP is less than full employment GDP. Equilibrium GDP is the level of spending that the economy is at or tending toward. Full employment GDP is the level of spending needed to provide enough jobs to reduce the unemployment rate to around 5%. When too little is being spent to provide jobs, we have a recessionary gap. How do we close the gap? We will need to raise spending—consumption (C) or (I) Investment or (G) government spending. Or we may want to lower taxes. Lowering business taxes might raise employment, lowering personal income taxes might increase consumption.
Inflationary Gap. The key difference between recessionary and inflationary is the equilibrium GDP. when there is an inflationary gap, equilibrium GDP is greater than full employment GDP when there’s a recessionary gap, full employment GDP is greater than equilibrium GDP.
To summarize: if spending is too high, equilibrium GDP is above full employment level. To eliminate an inflationary gap, we cut Government spending and/or raise taxes. If equilibrium GDP is less than full employment GDP, we eliminate the recessionary gap by raising Government spending and or cutting taxes.
Fiscal Policy to apply in Recession:
↑G
↓T
Fiscal Policy to apply in Inflation:
↓ G
↑ T
Making the Policy Better: The Multiplier Effect
The multiplier is based on two concepts:
1. GDP is the nation’s expenditure(spending) on all final goods and services produced during the year at market prices or GDP = C + I + G + Xn. It’s obvious that if it goes up, GDP will go up or that if it goes down so will GDP. When there is change in spending, that is in C, I , G, or Xn, it will have a multiplied effect on GDP.
2. Any change in spending C, I, or G, will set off a chain reaction, leading to a multiplied change in GDP. How much of a multiplied effect? A billion dollars increase in G might increase GDP by 50 billion and in that case, the multiplier is 5. If there is a decline of 5,000 in I, it causes GDP to fall by 40 billion, then the multiplier would be 8.
Multiplier Example
Suppose the government pays you $1,000 to write a report as an economic consultant. The MPC (marginal propensity to consume) Or the likelihood that this money will be spent in this economy is 0.5 (or 50%).
- You will spend $500 and save $500. Suppose you spend the $500 on a laptop.
- The seller of the laptop now has $500 in new income. The laptop seller spends $250 and saves $250. Suppose she spends the $250 on used textbooks.
- The used bookseller now has $250 in new income, so he spends $125 on concert tickets and saves $125.
- The concert promoter now has $125 in new income, so she spends $62.50 on a watch and saves $62.50.
- The watch seller now has $62.50 in new income, so he spends $31.25 buying gas and saves $31.25.
- And so on…
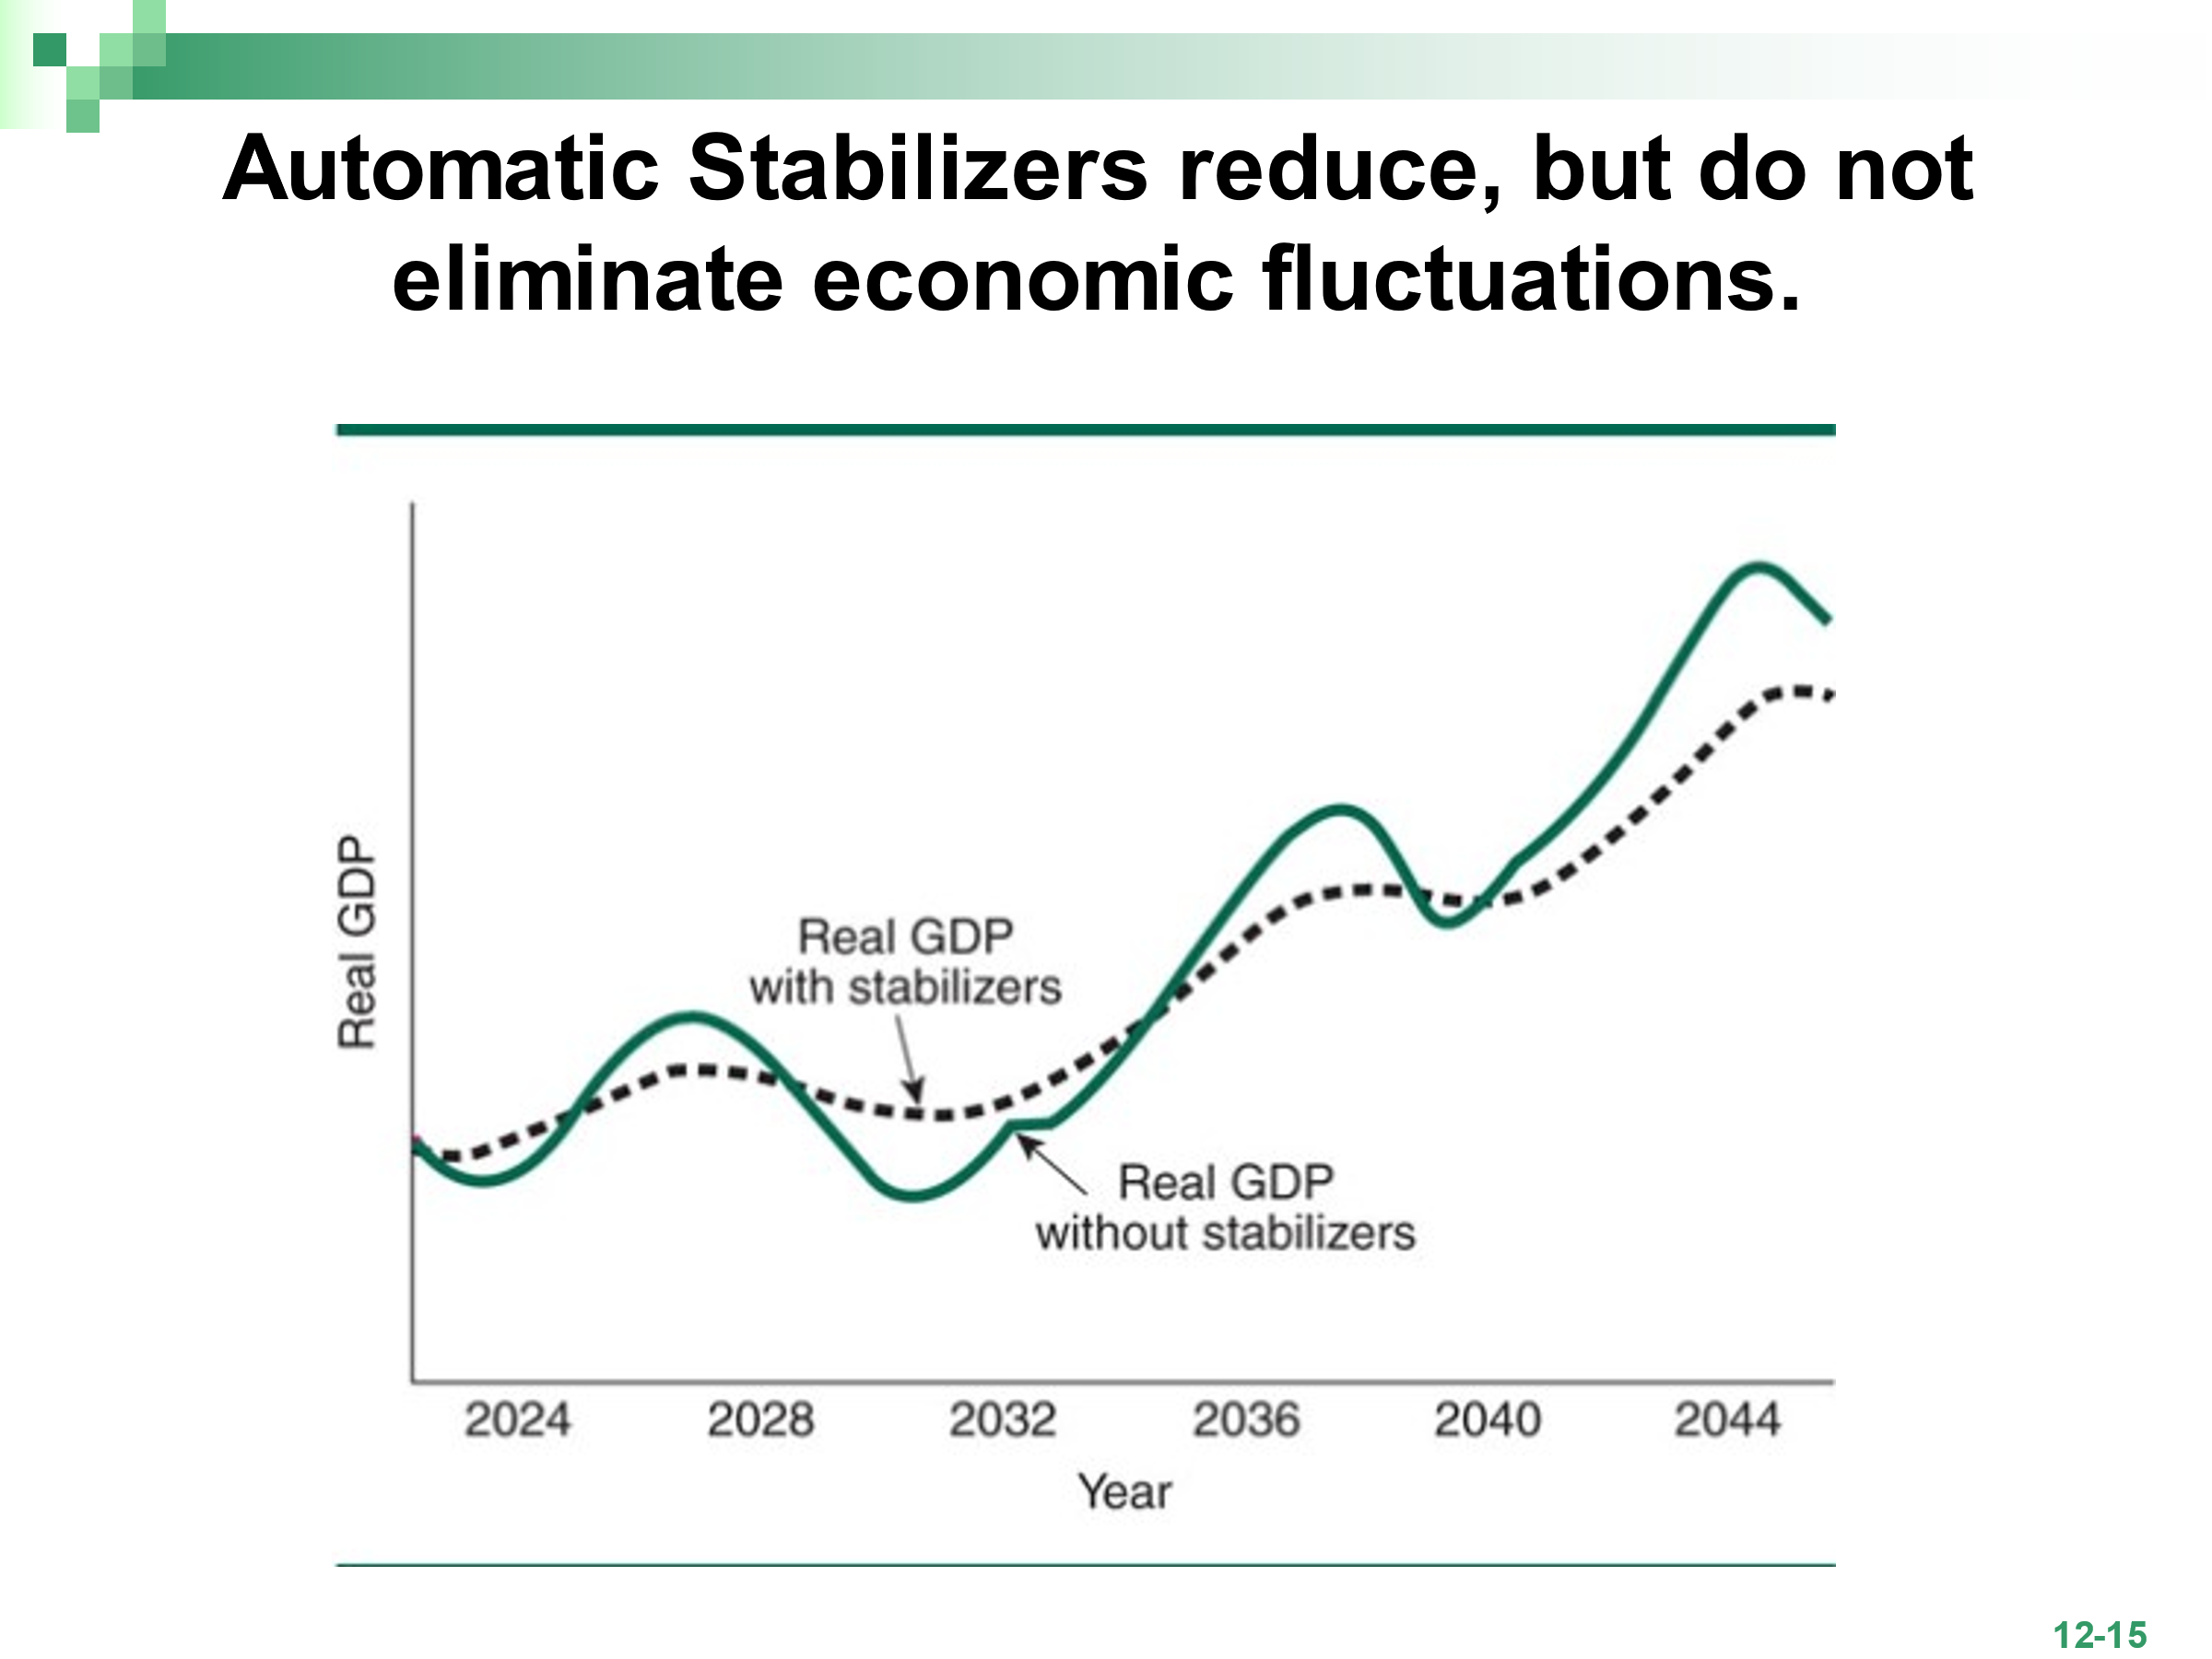
Examples of Fiscal Policy in Place: Automatic Stabilizers
Automatic stabilizers are programs such as unemployment insurance benefits and taxes that are already on the books to help alleviate recessions and hold down the rate of inflation. Our automatic stabilizers enable us to cruise along fairly smoothly, but when we hit severe economic turbulence, then we hope the president and Congress will take controls.
We will talk about automatic stabilizers first and then we will talk about discretionary fiscal policy which is our manual control system. Stabilizers protect the economy from the extremes of the business cycle: from a recession or inflation. Remember: we need expansionary policy in recessions to get the economy going and contractionary policy during high inflation to cool down the economy. But they are not, by themselves, expected to prevent booms and bust, but only to moderate them.
Personal Income Tax and Payroll Taxes
During recessions the government collects less personal income tax and Social Security tax than it otherwise would. Some workers who have been getting overtime before a recession are lucky to be hanging onto the jobs. Some workers are less lucky and have been laid off. During prosperous time are incomes rise, and during times of inflation our incomes tends to rise still faster. As our income rise, we have to pay more taxes. These taxes tend to hold down our spending, relieving inflationary pressures. During recessions, as income falls Federal Personal income and Social Security tax receipts fall faster. This moderates economic declines by leaving more money and taxpayers’ pockets.
Personal Savings
As the economy moves into a recession and people lose their jobs, most will be forced to dig into their savings to pay their bills. And as the economy picks up again the unemployed find jobs, they may replenish their savings.
Credit Availability
Because most Americans now hold bank credit cards, we may think of these as automatic stabilizers that work in the same way that personal savings does. During good times, we should be paying off credit card debts that we run up during bad times. Remember, a credit card is a short-term loan from a bank. A debit card is a tool used in place of cash to make purchases. Credit cards may be thought of as automatic stabilizers during recessions because they give us one more source of funds with which to keep buying things. For example, you may have lost your job and have no money in the bank, but your credit cards are just as good as money. Although, you will be charged a high rate of interest. Most Americans can take out home equity loans if they’re short on cash. But even if you’ve lost your job, the bank may not care since you’ve got your home as collateral. Best of all, you’ll pay a lower interest rate than what you would pay on your credit card debt.
Unemployment Compensation
During recessions, as the unemployment rate climbs, hundreds of thousands and then millions of people register for unemployment benefits. The tens of billions of dollars of unemployment benefits being paid out establish a floor under the purchasing power. People who are, they hope, only temporarily out of work will continue spending money. This helps keeps retail sales from falling much, and even without further government help, the economy has bought some time to work its way out of a recession. As the economy recovers and moves into the prosperity phase of the cycle, people find jobs more easily and unemployment benefits claims drop substantially.
Corporate Profit Tax
Perhaps the most counters cyclical of all automatic stabilizers is the corporate profit or income tax. Corporations must pay 21% of their net income to the federal government. During economic downturns, corporate profits fall much more quickly than wages, consumption, or real GDP; And of course, during expansions comic corporate profits rise much more rapidly.
Other Transfer Payments
Some people think that when a recession hits, the government automatically raises Social Security benefits. This might make sense, but it’s not what happens. Congress would have to pass special legislation to do this. Three important payments do rise automatically because of the laws already on the books. Each is aimed at helping the poor.
Payments: Welfare or public assistance payments, Medicaid payments, and food stamps.
These programs are important for two reasons, not only do they alleviate human suffering during bad economic times, but they also help provide a floor under spending, which helps keep economic downturns from worsening.
The automatic stabilizers smooth out the business cycle, keeping the ups and downs within a moderate range. Since the Great Depression, we have had neither another depression nor runaway inflation. But the stabilizers, by themselves cannot altogether eliminate economic fluctuations. The latter part of the expansions is held down in the hypothetical business cycles with stabilizers in place, and the contractions are less severe. basically, then, that automatic stabilizer smooths out the business cycle but they do not eliminate it. Taxation
Learning Objectives
By the end of this section, you will be able to:
- Differentiate among a regressive tax, a proportional tax, and a progressive tax
- Identify major revenue sources for the U.S. federal budget
There are two main categories of taxes: those that the federal government collects and those that the state and local governments collect. What percentage the government collects and for what it uses that revenue varies greatly. The following sections will briefly explain the taxation system in the United States.
Taxes are paid by most, but not all, people who work. Even if you are part of the so-called “1099” or “gig” economy, you are considered an independent contractor and must pay taxes on the income you earn in those occupations. Taxes are also paid by consumers whenever they purchase goods and services. Taxes are used for all sorts of spending—from roads, to bridges, to schools (K–12 and public higher education), to police and other public safety functions. Taxes fund vital public services that support our communities.
Federal Taxes
Just as many Americans erroneously think that federal spending has grown considerably, many also believe that taxes have increased substantially. The top line of Figure 30.5 shows total federal taxes as a share of GDP since 1960. Although the line rises and falls, it typically remains within the range of 17% to 20% of GDP, except for 2009–2011, when taxes fell substantially below this level, due to the Great Recession.
Figure 30.5 Federal Taxes, 1960–2020 Federal tax revenues have been about 17–20% of GDP during most periods in recent decades. The primary sources of federal taxes are individual income taxes and the payroll taxes that finance Social Security and Medicare. Corporate income taxes and social insurance taxes provide smaller shares of revenue. (Source: Economic Report of the President, 2021. Table B-47, https://www.govinfo.gov/app/collection/erp/2021)
Figure 30.5 also shows the taxation patterns for the main categories that the federal government taxes: individual income taxes, corporate income taxes, and social insurance and retirement receipts. When most people think of federal government taxes, the first tax that comes to mind is the individual income tax that is due every year on April 15 (or the first business day after). The personal income tax is the largest single source of federal government revenue, but it still represents less than half of federal tax revenue.
The second largest source of federal revenue is the payroll tax (captured in social insurance and retirement receipts), which provides funds for Social Security and Medicare. Payroll taxes have increased steadily over time. Together, the personal income tax and the payroll tax accounted for over 85% of federal tax revenues in 2020. Although personal income tax revenues account for more total revenue than the payroll tax, nearly three-quarters of households pay more in payroll taxes than in income taxes.
The income tax is a progressive tax, which means that the tax rates increase as a household’s income increases. Taxes also vary with marital status, family size, and other factors. The marginal tax rates (the tax due on all yearly income) for a single taxpayer range from 10% to 35%, depending on income, as the following Clear It Up feature explains.
Clear It Up
How does the marginal rate work?
Suppose that a single taxpayer’s income is $35,000 per year. Also suppose that income from $0 to $9,075 is taxed at 10%, income from $9,075 to $36,900 is taxed at 15%, and, finally, income from $36,900 and beyond is taxed at 25%. Since this person earns $35,000, their marginal tax rate is 15%.
The key fact here is that the federal income tax is designed so that tax rates increase as income increases, up to a certain level. The payroll taxes that support Social Security and Medicare are designed in a different way. First, the payroll taxes for Social Security are imposed at a rate of 12.4% up to a certain wage limit, set at $137,700 in 2020. Medicare, on the other hand, pays for elderly healthcare, and is fixed at 2.9%, with no upper ceiling.
In both cases, the employer and the employee split the payroll taxes. An employee only sees 6.2% deducted from their paycheck for Social Security, and 1.45% from Medicare. However, as economists are quick to point out, the employer’s half of the taxes are probably passed along to the employees in the form of lower wages, so in reality, the worker pays all of the payroll taxes. If you are a member of the “gig economy” and receive a 1099 tax statement, then you are considered an independent contractor and so you must pay the employee and employer side of the payroll tax.
We also call the Medicare payroll tax a proportional tax; that is, a flat percentage of all wages earned. The Social Security payroll tax is proportional up to the wage limit, but above that level it becomes a regressive tax, meaning that people with higher incomes pay a smaller share of their income in tax.
The third-largest source of federal tax revenue, as Figure 30.5 shows is the corporate income tax. The common name for corporate income is “profits.” Over time, corporate income tax receipts have declined as a share of GDP, from about 4% in the 1960s to an average of 1% to 2% of GDP in the past 40 years.
The federal government has a few other, smaller sources of revenue. It imposes an excise tax—that is, a tax on a particular good—on gasoline, tobacco, and alcohol. As a share of GDP, the amount the government collects from these taxes has stayed nearly constant over time, from about 2% of GDP in the 1960s to roughly 3% by 2020, according to the nonpartisan Congressional Budget Office. The government also imposes an estate and gift tax on people who pass large amounts of assets to the next generation—either after death or during life in the form of gifts. These estate and gift taxes collected about 0.2% of GDP in 2020. By a quirk of legislation, the government repealed the estate and gift tax in 2010, but reinstated it in 2011. Other federal taxes, which are also relatively small in magnitude, include tariffs the government collects on imported goods and charges for inspections of goods entering the country.
State and Local Taxes
At the state and local level, taxes have been rising as a share of GDP over the last few decades to match the gradual rise in spending, as Figure 30.6 illustrates. The main revenue sources for state and local governments are sales taxes, property taxes, and revenue passed along from the federal government, but many state and local governments also levy personal and corporate income taxes, as well as impose a wide variety of fees and charges. The specific sources of tax revenue vary widely across state and local governments. Some states rely more on property taxes, some on sales taxes, some on income taxes, and some more on revenues from the federal government. If the automatics stabilizers are not helping enough, then the government may turn to discretionary fiscal policy.
Discretionary Fiscal Policy
Among the first words of this chapter were: Fiscal policy is a manipulation of the federal budget to attain price stability, relatively full employment, and a satisfactory rate of economic growth. The automatic stabilizers, which swing the federal budget into substantial deficits during recession and tend to push those deficits down during periods of inflation, would appear to be part of fiscal policy. Because they are built into our economy, one might call them a passive fiscal policy.
Making Automatic Stabilizers More Effective
One problem with unemployment benefits is they run out in 6 months while the recession can drag on for more than a year. And its effects can last still longer. Extending the benefit is an example of discretionary fiscal policy because benefits are not extended automatically. And in the wake of the Great Recession (2007-2009), unemployment insurance benefits were extended for as long as 99 weeks in states with the highest rates of unemployment. Benefits have been extended in every recession except one since the 1950s.
Public Works
During the Great Depression, the Roosevelt administration set up several so-called alphabet agencies to provide jobs for the long-term unemployed. Among them, the Works Progress Administration or WPA the Civil Conservation Corps, CCC and the Public Works Administration, PWA. These put millions of people to work doing everything from raking lease to constructing government buildings. Keep in mind: During good times and bad, whether fiscal stimulus is needed or not, the political pressure within Congress for federal spending on local projects is constant. This spending, which might have made sense during a time of high unemployment, could hardly be considered wise fiscal policy measure when the nation’s unemployment rate is below 5%.
John Maynard Keynes suggested responsible fiscal policy is to lower taxes and raise spending during recessions and to put it back during inflation: meaning raise taxes back up and cut the spending. However, politicians have a very hard time raising taxes and lowering spending – even if it is what we need to do. This is one of the biggest reasons we have a huge national debt.
Changes in Tax Rates
So far, the policy measures have dealt exclusively with recessions. What can we do to fight inflation? We can raise taxes. In the case of a recession, a tax cut would be the ticket. Corporate income taxes, too, maybe raised during inflation and lowered when recessions occur.
Fiscal Policy Lags
The effectiveness of Fiscal Policy depends greatly on timing. Unfortunately, it is the subject to three lags: the recognition, decision and impact. The recognition lag is the time it takes for the policy makers to realize that that a business cycles turning point has been passed, or that inflation or employment has become a particular problem. The decision lag is the time it takes for policy makers to decide what to do and then to take action. The impact lag is the time it takes for the policy action to have substantial effect. The whole process may take anywhere from 9 months to more than 3 years.
Great Recession Lags
President Bush and President Obama used fiscal policy to stimulate the economy in response to The Great Recession:
- Recognition lag: Although there were strong signs of an economic slowdown during Fall 2007, the Bush administration and many members of Congress did not use the word “recession” until the unemployment rate rose to 5.0% in January 2008.
- Decision lag: The Bush administration and Congress took just a few weeks to agree to a $168 billion economic stimulus package that focused on taxpayer rebates (tax cuts).
- Impact lag: The IRS did not mail out the rebates until May 2008. And many people used the rebates to pay down debt rather than increasing spending. It was too small to have much of an impact.
Economic Stimulus: Fiscal Policy Examples from the Great Recession
President Obama passed a $787 billion stimulus package.
- It included $287 billion in tax cuts and $500 in government spending.
- $233 billion in tax cuts for individuals and families
- $106 billion for education and job training, including aid to states to prevent cutbacks and layoffs
- $87 billion to states for increased Medicaid costs
- $78 billion for programs for jobless workers
- $48 billion for highway and bridge construction and mass transit
- $44 billion for energy programs, modernization of electric grid
- $41 billion for other infrastructure and environment projects
- $29 billion for health, science, and research
- $21 billion for energy investments
- $20 billion to expand food stamp benefits
- By end of 2009, only 1/3 of funds had entered the economy.
Is The Deficit Too Big?
Budget deficits rise automatically during recessions because tax receipts fall and some government spending programs rise. But the huge economic 2009 stimulus program helped push the deficit to 1.413 trillion and more than tripled the record budget deficit we ran in fiscal year 2008. A good deal of this came from the Bush administration’s tax cuts during the recession that were never put back into the budget. Some of these corporate tax cuts remain today.
In the long run, large deficits may drive our government into bankruptcy because we could we may not be able to continue borrowing large sums of money. And definitely we have run larger deficits and –more time– the question is– what would have happened to the economy had we not run such a large deficit the recession may have been even worse.
Deficit and Balanced Budgets
To understand how fiscal policy works to creates deficit or surpluses, we need to deal with three concepts:
Deficit Budget: a budget deficit is when the government spending is greater than tax revenue. The government is paying out more than it’s taking in. How does it makeup the difference? It borrows. Deficits have been much more common than surpluses. In fact, the federal government has run budget deficits every year from 1970 through 2000 and then again from 2001 – 2023.
Budget Surpluses: budget surpluses are the exact opposite of deficits. when the budget is in a surplus position, tax revenue is greater than government spending.
Balanced Budget: is when the government expenditures are equal to tax revenue. We’ve never had an exactly balanced budget.
Large deficits are bad because they tend to raise interest rates, which in turn, discourages investment. The federal government has become increasingly dependent on foreign savers to finance the deficit. The deficit soaks up large amounts of personal savings in this country, making much less savings available to large corporate borrowers seeking funds for new plant equipment. Because deficits are tacked on to the national debt, the higher our deficits the more interest we will have to pay on the national debt. This money might otherwise have gone to pay for other government services such as education, healthcare, infrastructure, national parks, and public transportation.
Crowding In and Crowding Out Effects
If the proper fiscal policy during a recession is a large budget deficit, one would wonder where does the US Treasury get all this money. Presumably it will go out and borrow it. But from whom?
If it borrows funds from individuals who would have otherwise made this money available for business investments – won’t business borrowers be crowded out of the financial market by the government? And won’t interest rates be driven up in the process? Making it more discouraging to invest? Won’t government spending financed by borrowing be replacing private investment spending? Yes.
During recessions business firms cut back on their investing, so the government would be tapping a relatively idle source of funds, and during recession interest rates tend to fall.
This may be called the crowding out effect. The crowding out effect is large federal budget deficits that are financed by Treasury borrowing, which then crowds out private borrowers from the financial markets and drives up interest rates.
Crowding In Effect
An increase in the private sector spending stimulated by the federal budget deficits financed by US Treasury borrowing.
The National Debt
The National Debt is the amount of currently outstanding Federal Securities that the Treasury has issued – represents what the federal government owes.
The National Debt is the cumulative total of all federal budget deficits less any surpluses. Much of it was accumulated up during recessions and wars.
The National Debt is the total amount of money owed by the government. The federal budget deficit is the yearly amount by which spending exceeds revenue. Add up all the deficits (and subtract those few budget surpluses we’ve had) for the past 200+ years and you’ll get the current National Debt.
https://fiscaldata.treasury.gov/americas-finance-guide/
Who Holds the National Debt
First, we need to differentiate between publicly held debt and debt held by US government agencies.
Debt Held by the Public: This consists of all national debt held by any person or entity that is not a U.S. federal government agency. This includes individuals, corporations, state or local governments, Federal Reserve Banks, foreign investors, foreign governments, and other entities outside the United States Government. The terms of these securities can range in maturity, the way they are sold to investors, and the structure of their interest payments. Debt held by the public does not include intragovernmental debt. For a list of foreign investors holding national debt, visit the Treasury International Capital (TIC) System.
Intragovernmental Holdings: These comprise debt that one part of the U.S. Federal Government owes to another part. This represents cases where Social Security, Medicare, and other federal programs collect more revenue than they need in a year and then purchase Treasury debt for their trust funds.
About 27% is held by US government agencies and about 73% by the public. Although the national debt has been increasing at an alarming pace since 2002, is this really something we should be worried about? After all, don’t we owe it to ourselves. To the degree that the debt is being held increasingly by foreigners, we can no longer say we owe it only to ourselves. And in the future, even if we never pay back one penny of the debt, our children and grandchildren will have to pay foreigners hundreds of billions of dollars a year in interest. at least to that degree, the public debt will be a burden for future generations.
Foreign Owners:
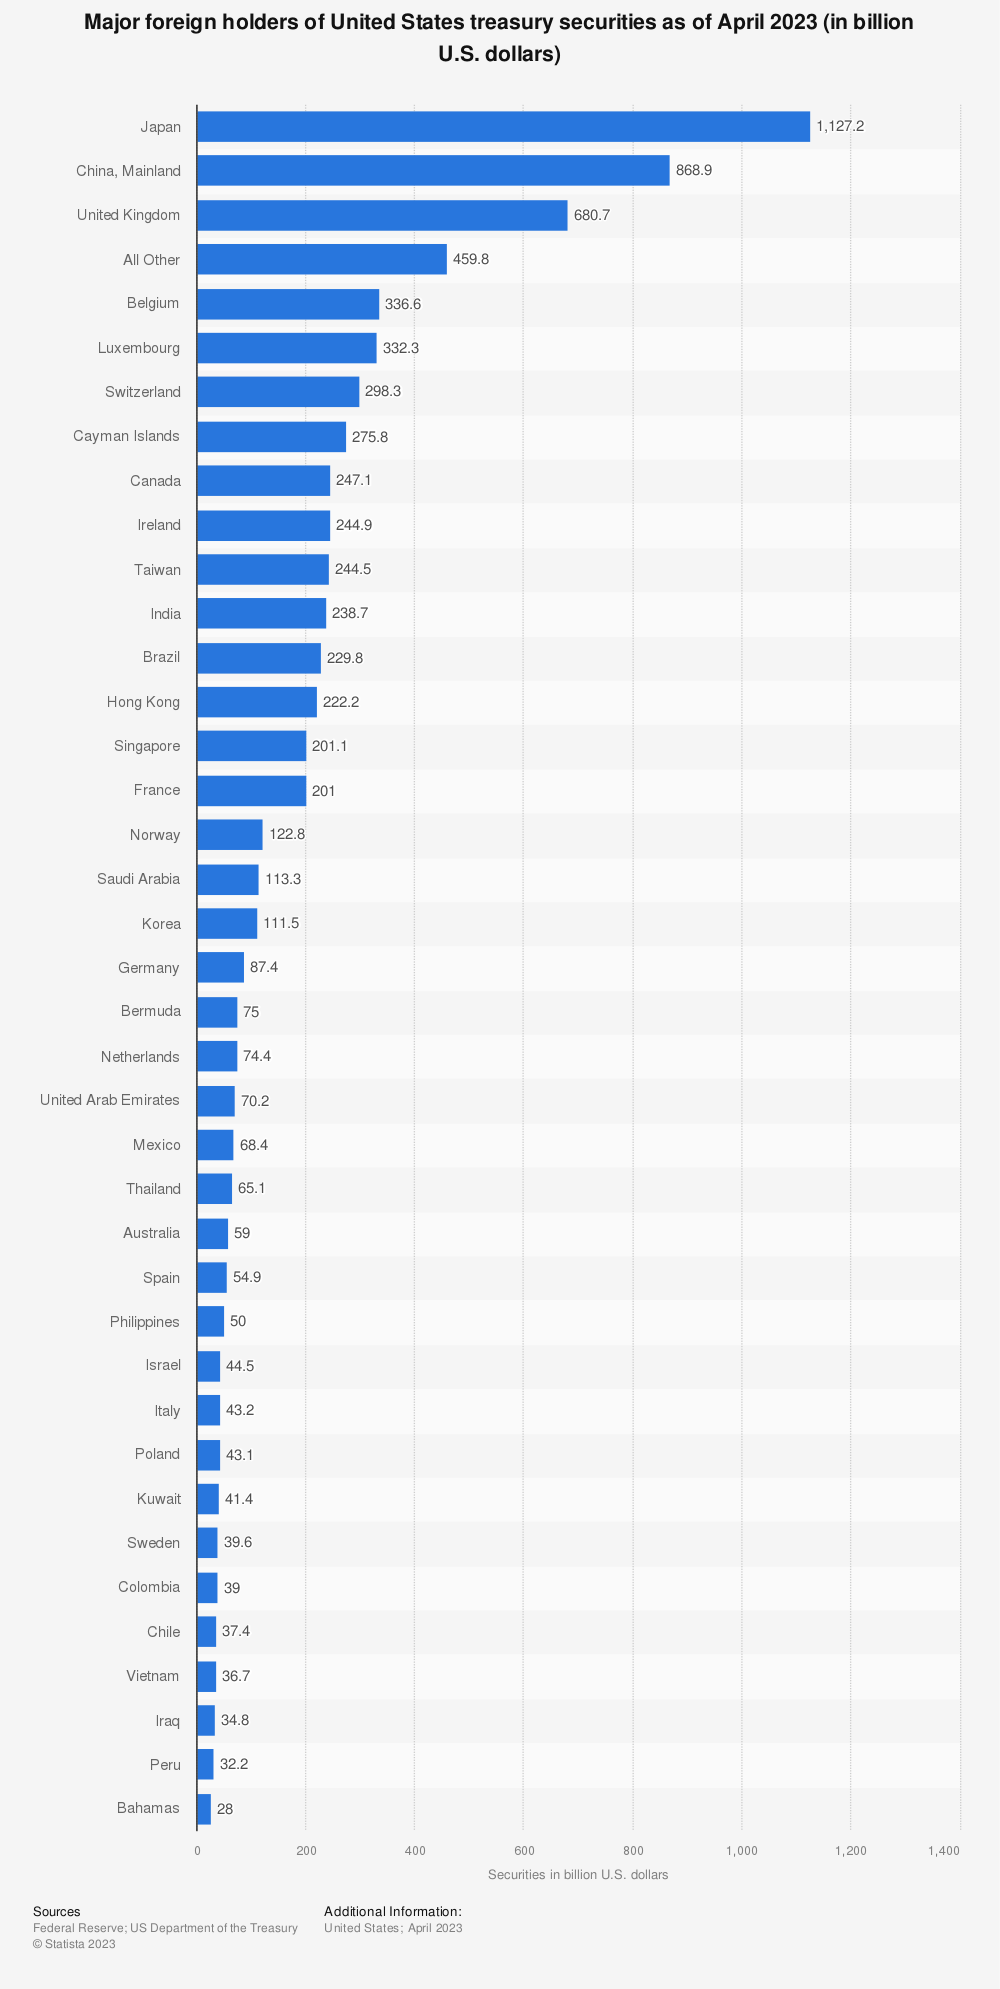
For Full image: https://www.statista.com/statistics/246420/major-foreign-holders-of-us-treasury-debt/
Per Capita Debt
Our national debt is the amount of money that is owed by every man, woman, and child in the United States. How does every human being in the United States how much do we actually owe per capita. Take a look at https://www.usdebtclock.org/ It is about 97,000 per citizen.
Access for free at https://openstax.org/books/principles-economics-3e
