44 How to Measure Changes in the Cost of Living
How to Measure Changes in the Cost of Living
Learning Objectives
By the end of this section, you will be able to:
- Use the Consumer Price Index (CPI) to calculate U.S. inflation rates
- Identify several ways the Bureau of Labor Statistics avoids biases in the Consumer Price Index (CPI)
- Differentiate among the Consumer Price Index (CPI), the Producer Price Index (PPI), the International Price Index, the Employment Cost Index, and the GDP deflator
The most commonly cited measure of inflation in the United States is the Consumer Price Index (CPI). Government statisticians at the U.S. Bureau of Labor Statistics calculate the CPI based on the prices in a fixed basket of goods and services that represents the purchases of the average family of four.
Imagine that over the past 10 years, the cost of purchasing a fixed basket of goods increased by 25% and your salary also increased by 25%. Has your personal standard of living held constant? If you do not necessarily purchase an identical fixed basket of goods every year, then an inflation calculation based on the cost of a fixed basket of goods may be a misleading measure of how your cost of living has changed. Two problems arise here: substitution bias and quality/new goods bias.
Substitution
When the price of a good rises, consumers tend to purchase less of it and to seek out substitutes instead. Conversely, as the price of a good falls, people will tend to purchase more of it. This pattern implies that goods with generally rising prices should tend over time to become less important in the overall basket of goods used to calculate inflation, while goods with falling prices should tend to become more important. Consider, as an example, a rise in the price of peaches by $100 per pound. If consumers were utterly inflexible in their demand for peaches, this would lead to a big rise in the price of food for consumers. Alternatively, imagine that people are utterly indifferent to whether they have peaches or other types of fruit. Now, if peach prices rise, people completely switch to other fruit choices and the average price of food does not change at all. A fixed and unchanging basket of goods assumes that consumers are locked into buying exactly the same goods, regardless of price changes—not a very likely assumption. Thus, substitution bias—the rise in the price of a fixed basket of goods over time—tends to overstate the rise in a consumer’s true cost of living, because it does not take into account that the person can substitute away from goods whose relative prices have risen.
New Goods Bias
The other major problem in using a fixed basket of goods as the basis for calculating inflation is how to deal with the arrival of improved versions of older goods or altogether new goods. Consider the problem that arises if a cereal is improved by adding 12 essential vitamins and minerals—and also if a box of the cereal costs 5% more. It would clearly be misleading to count the entire resulting higher price as inflation, because the new price reflects a higher quality (or at least different) product. Ideally, one would like to know how much of the higher price is due to the quality change, and how much of it is just a higher price. The Bureau of Labor Statistics, which is responsible for computing the Consumer Price Index, must deal with these difficulties in adjusting for quality changes.
Link It Up
Visit this website to view a list of Ford car prices between 1909 and 1927. Consider how these prices compare to today’s models. Is the product today of a different quality?
The arrival of new goods creates problems with respect to the accuracy of measuring inflation. The reason people buy new goods, presumably, is that the new goods offer better value for money than existing goods. Thus, if the price index leaves out new goods, it overlooks one of the ways in which the cost of living is improving. In addition, the price of a new good is often higher when it is first introduced and then declines over time. If the new good is not included in the CPI for some years, until its price is already lower, the CPI may miss counting this price decline altogether. Taking these arguments together, the quality/new goods bias means that the rise in the price of a fixed basket of goods over time tends to overstate the rise in a consumer’s true cost of living, because it does not account for how improvements in the quality of existing goods or the invention of new goods improves the standard of living. The following Clear It Up feature is a must-read on how statisticians comprise and calculate the CPI.
Clear It Up
How do U.S. government statisticians measure the Consumer Price Index?
When the U.S. Bureau of Labor Statistics (BLS) calculates the Consumer Price Index, the first task is to decide on a basket of goods that is representative of the purchases of the average household. We do this by using the Consumer Expenditure Survey, a national survey of about 7,000 households, which provides detailed information on spending habits. Statisticians divide consumer expenditures into eight major groups (seen below), which in turn they divide into more than 200 individual item categories. The BLS currently uses 1982–1984 as the base period.
For each of the 200 individual expenditure items, the BLS chooses several hundred very specific examples of that item and looks at the prices of those examples. In figuring out the “breakfast cereal” item under the overall category of “foods and beverages,” the BLS picks several hundred examples of breakfast cereal. One example might be the price of a 24-oz. box of a particular brand of cereal sold at a particular store. The BLS statistically selects specific products and sizes and stores to reflect what people buy and where they shop. The basket of goods in the Consumer Price Index thus consists of about 80,000 products; that is, several hundred specific products in over 200 broad-item categories. Statisticians rotate about one-quarter of these 80,000 specific products of the sample each year, and replace them with a different set of products.
The next step is to collect data on prices. Data collectors visit or call about 23,000 stores in 87 urban areas all over the United States every month to collect prices on these 80,000 specific products. The BLS also conducts a survey of 50,000 landlords or tenants to collect information about rents.
Statisticians then calculate the Consumer Price Index by taking the 80,000 prices of individual products and combining them, using weights (see Figure 22.2) determined by the quantities of these products that people buy and allowing for factors like substitution between goods and quality improvements, into price indices for the 200 or so overall items. Then, the statisticians combine the price indices for the 200 items into an overall Consumer Price Index. According the Consumer Price Index website, there are eight categories that data collectors use:
The Eight Major Categories in the Consumer Price Index
- Food and beverages (breakfast cereal, milk, coffee, chicken, wine, full-service meals, and snacks)
- Housing (renter’s cost of housing, homeowner’s cost of housing, fuel oil, bedroom furniture)
- Apparel (men’s shirts and sweaters, women’s dresses, jewelry)
- Transportation (new vehicles, airline fares, gasoline, motor vehicle insurance)
- Medical care (prescription drugs and medical supplies, physicians’ services, eyeglasses and eye care, hospital services)
- Recreation (televisions, cable television, pets and pet products, sports equipment, admissions)
- Education and communication (college tuition, postage, telephone services, computer software and accessories)
- Other goods and services (tobacco and smoking products, haircuts and other personal services, funeral expenses)
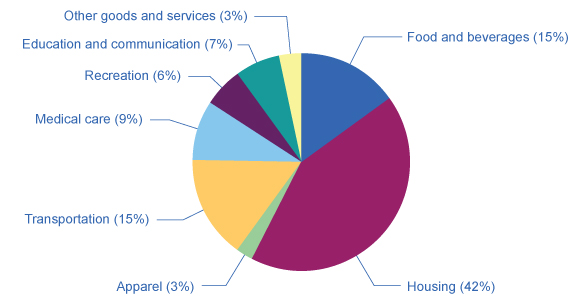
Figure 22.2 The Weighting of CPI Components Of the eight categories used to generate the Consumer Price Index, housing is the highest at 42.4%. The next highest category, food and beverage at 15.1%, is less than half the size of housing. Other goods and services, and apparel, are the lowest at 3.2% and 2.7%, respectively. (Source: www.bls.gov/cpi)
The CPI and Core Inflation Index
CPI measures prices as they affect everyday household spending. Economists typically calculate a core inflation index by taking the CPI and excluding volatile economic variables. In this way, economists have a better sense of the underlying trends in prices that affect the cost of living.
Examples of excluded variables include energy and food prices, which can jump around from month to month because of the weather.
As former Chairman of the Federal Reserve Ben Bernanke noted in 1999 about the core inflation index, “It provide(s) a better guide to monetary policy than the other indices, since it measures the more persistent underlying inflation rather than transitory influences on the price level.” Bernanke also noted that it helps communicate that the Federal Reserve does not need to respond to every inflationary shock since some price changes are transitory and not part of a structural change in the economy.
In sum, both the CPI and the core inflation index are important, but serve different audiences. The CPI helps households understand their overall cost of living from month to month, while the core inflation index is a preferred gauge from which to make important government policy changes.
Additional Price Indices: PPI, GDP Deflator, and More
The basket of goods behind the Consumer Price Index represents an average hypothetical U.S. household’s consumption, which is to say that it does not exactly capture anyone’s personal experience. When the task is to calculate an average level of inflation, this approach works fine. What if, however, you are concerned about inflation experienced by a certain group, like the elderly, or the poor, or single-parent families with children, or Hispanic-Americans? In specific situations, a price index based on the buying power of the average consumer may not feel quite right.
This problem has a straightforward solution. If the Consumer Price Index does not serve the desired purpose, then invent another index, based on a basket of goods appropriate for the group of interest. The Bureau of Labor Statistics publishes a number of experimental price indices: some for particular groups like the elderly or the poor, some for different geographic areas, and some for certain broad categories of goods like food or housing.
The BLS also calculates several price indices that are not based on baskets of consumer goods. For example, the Producer Price Index (PPI) is based on prices paid for supplies and inputs by producers of goods and services. We can break it down into price indices for different industries, commodities, and stages of processing (like finished goods, intermediate goods, or crude materials for further processing). There is an International Price Index based on the prices of merchandise that is exported or imported. An Employment Cost Index measures wage inflation in the labor market. The GDP deflator, which the Bureau of Economic Analysis measures, is a price index that includes all the GDP components (that is, consumption plus investment plus government plus exports minus imports). Unlike the CPI, its baskets are not fixed but re-calculate what that year’s GDP would have been worth using the base-year’s prices. MIT’s Billion Prices Project is a more recent alternative attempt to measure prices: economists collect data online from retailers and then put them into an index that they compare to the CPI (Source: http://bpp.mit.edu/usa/).
What’s the best measure of inflation? If one is concerned with the most accurate measure of inflation, one should use the GDP deflator as it picks up the prices of goods and services produced. However, it is not a good measure of the cost of living as it includes prices of many products not purchased by households (for example, aircraft, fire engines, factory buildings, office complexes, and bulldozers). If one wants the most accurate measure of inflation as it impacts households, one should use the CPI, as it only picks up prices of products purchased by households. That is why economists sometimes refer to the CPI as the cost-of-living index. As the Bureau of Labor Statistics states on its website: “The ‘best’ measure of inflation for a given application depends on the intended use of the data.”
Access for free at https://openstax.org/books/principles-economics-3e
