3 Working with Graphics and Text Tools in Microsoft Word
Learning Objectives
By the end of this section, you will be able to:
- Insert and modify a table
- Use tools in the illustrations command group to enhance documents’ visual appeal
- Use the Text command group to enhance and format documents
- Use the Symbols command group to insert special characters and equations
The WorldCorp market trends report will include more than just text. It will incorporate graphics and images to visually convey the information in the report. Some of these graphics are needed to show the relationship between product lines and distribution centers. Other graphics are used to visually summarize information. In this section, you will learn about the tools for creating engaging, professional graphics within Word.
Tables
Tables are a critical feature of many business documents. They are typically the most popular way of presenting results and/or data. They are particularly useful for presenting simple data with only one or two variables. You can easily glance at a table to see, for example, how many sales were made in a given month by a given group of salespeople. In other words, tables are a good way of presenting a limited amount of information in an easy-to-read format. Keep in mind that they are not best suited for complex data or information sets with multiple variables, as the tables can quickly become overloaded with information and hard to read.
You need to create a table to summarize WorldCorp sales information for the market trends report. The following columns will be needed: Product, Quantity, Price, Revenue. This information will be arranged in four rows to represent the four different product lines. (Remember that rows are represented horizontally from left to right, and columns vertically from top to bottom.) To insert a table, go to the Table drop-down menu on the Insert tab and select the number of rows and columns you want for the table by hovering over the squares (see Figure 4.17). For this example, you need four columns and five rows (the products plus the column heading row). You can add more rows or columns after the table is created if needed.
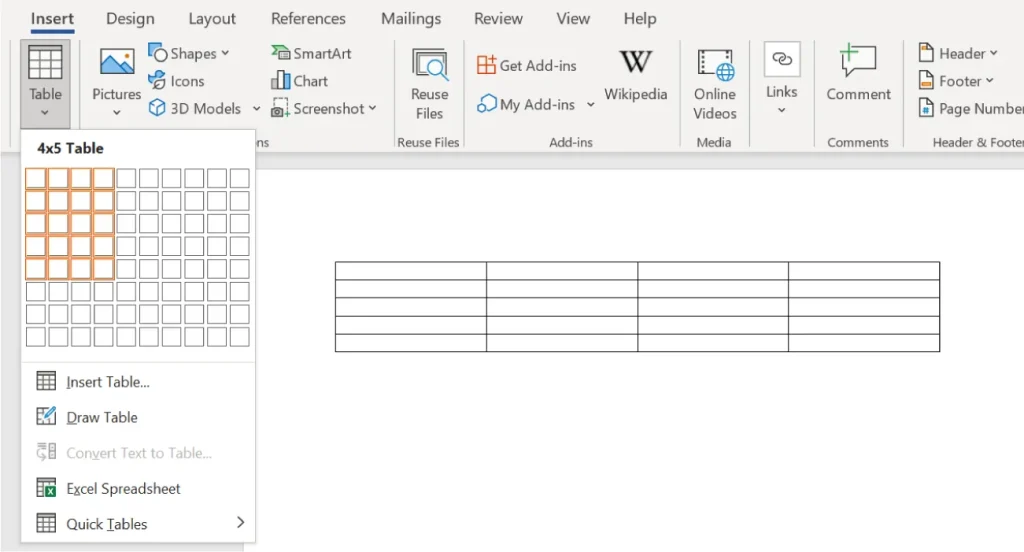
Figure 4.17 The Table tool provides an easy-to-use visual guide for creating tables. (Used with permission from Microsoft)
When you insert the table, the ribbon changes, giving you two additional tabs for changing the formatting and layout of the table. In Figure 4.18 you can see two new tabs: Table Design and Layout tab. These tabs open automatically when a table is inserted into the document. You can modify the table as a whole by selecting one of the Table Styles in the new Design tab. Select the whole table, then Table Styles, and then choose style; we have chosen one with alternating white and blue rows. You can now add the desired text to the table with the new table style.
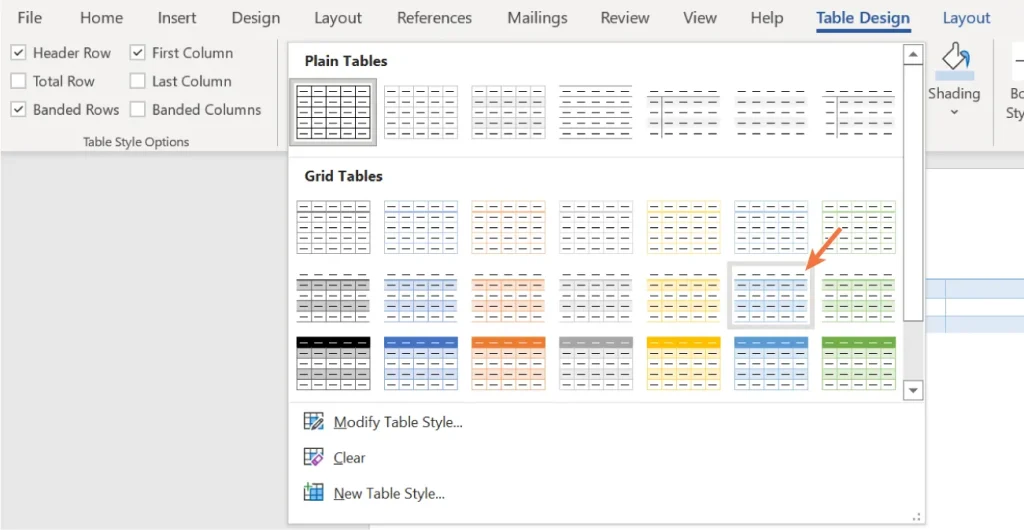
Figure 4.18 With the built-in styles, you can customize the table for a more visually appealing look. (Used with permission from Microsoft)
To add new rows or columns to your table, go to the other new tab, Layout. There are options for adding rows and columns above and below, or to the right and left, of the one you currently have your cursor on. This makes it easy to expand your table as you add more information. Select the area in the table you want to expand such as the column or row. Then, choose the applicable tool from the Layout menu. In this example, we chose Insert Below and Insert Right. In Figure 4.19, you can see an added row to the bottom of the table, and a new column named YoY Same Month. (“YoY” stands for “Year over Year.”)
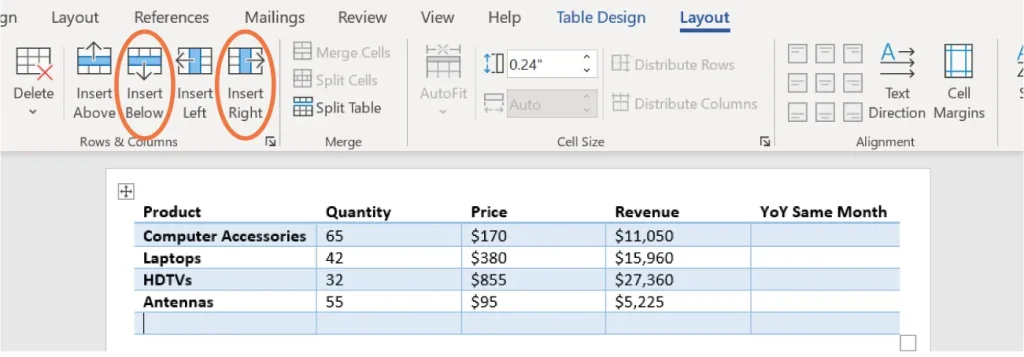
Figure 4.19 The Layout tab tools are used to make physical adjustments to the table, such as inserting or deleting rows or columns. (Used with permission from Microsoft)
Illustrations Command Group
The Illustrations command group is for inserting images, shapes, SmartArt, or charts. For the market trends report, you will be inserting some graphs and charts that show the size of the market and other related information. You might also want to include images of new developments in the industry or current products on the market from competitors. The Creating and Working in Documents chapter covered the arrangement and aligning of objects. This section will cover how to insert different types of objects.
Inserting Pictures
When inserting a picture into your document, you can choose to get a picture from the internet, from stock images in Office, or from a picture saved on your computer. (Always make sure you are not violating copyright or using pictures from proprietary sites without giving proper credit to the image creator or site.) In a business report, you might want to include images of your products or your office building. These photos will probably already be saved on your computer or be available on your shared company hard drive. To add a picture from a file saved on your computer, go to the Insert tab, choose Pictures, then select This Device from the drop-down menu (Figure 4.20). From the dialog box, choose the picture file you want to insert. The picture will be inserted at the location of your cursor.
You may also choose to insert some stock images available through Office. Stock images are photos or other images that are already licensed for general use through whatever platform you are using. There are stock image repositories, such as Getty; Office has its own repository of stock images, which you can access by selecting Stock Images from the Pictures drop-down menu. These images are searchable and include photos, icons, and cartoons.
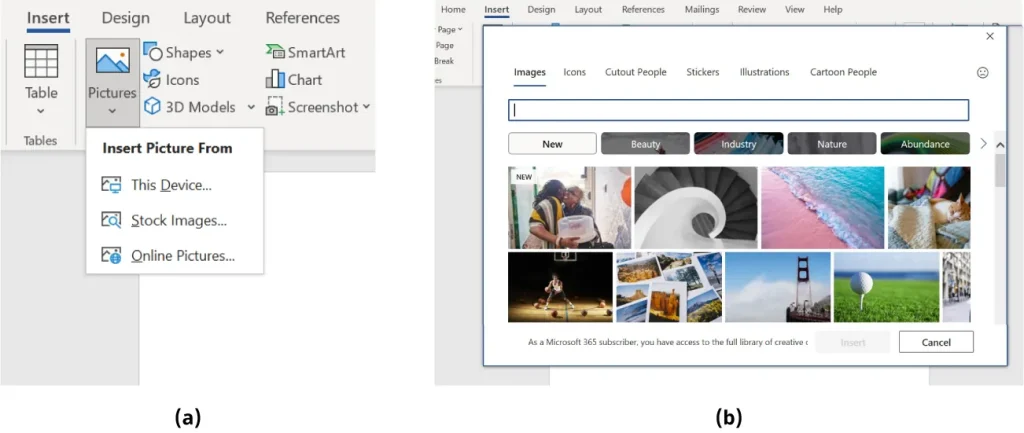
Figure 4.20 (a) Word makes it easy for you to insert images from a variety of locations into their document. (b) The Office stock images give you different options for more generic images or cartoons. (Used with permission from Microsoft)
Word also gives you the option of inserting a picture directly from the internet. If you choose Online Pictures, a dialog box will open, with Microsoft Bing’s image search available, as Figure 4.21 shows. This might be a nice option if you want to include a picture of a competitor’s product in the market trends report.
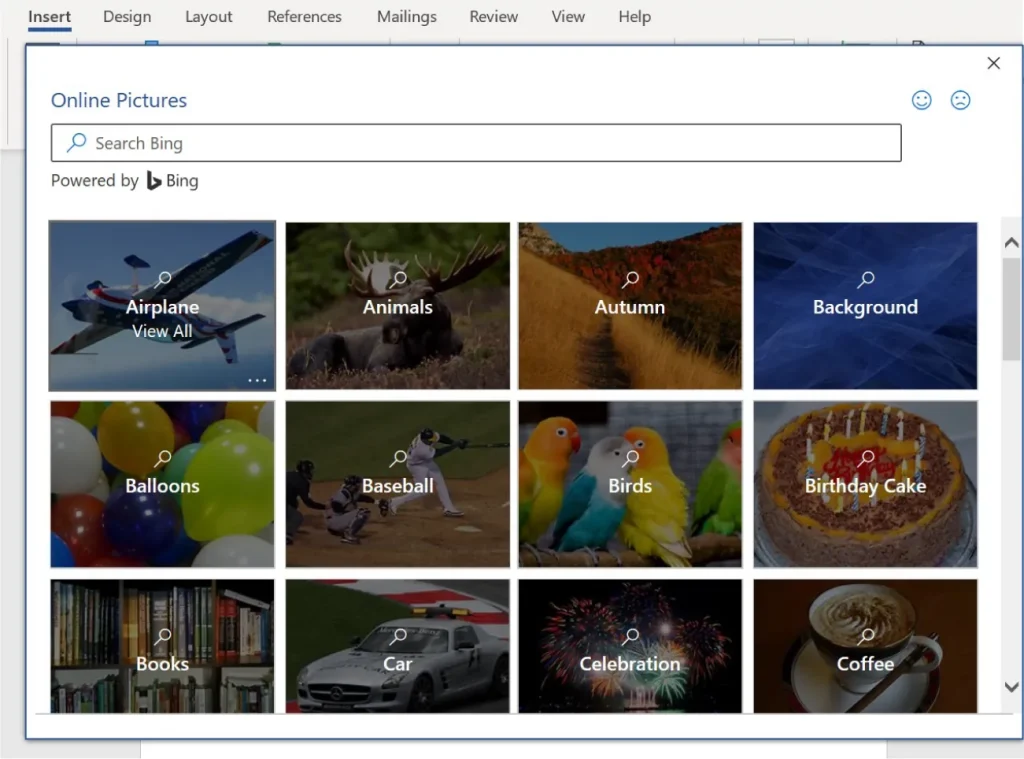
Figure 4.21 Bing’s image search tool helps you look for images by categorizing them by topic. (Used with permission from Microsoft)
Let’s find images of laptops for the WorldCorp market trends report. Let’s include one stock image and one online picture. For now, insert the images in a blank document just for practice. Later, you can insert the images into the market trends report if you desire. Open a blank document and go to the Insert tab.
Choose Picture and then choose Stock Images. Choose the Icons tab and, in the search bar, type “laptop” (Figure 4.22). This will narrow our search to icons, or simple black-and-white illustrations, rather than photographs. This type of image might be useful in a report because it is clear and simple. Notice that when an icon is inserted into the document, a new tab, Graphics Format, appears on the ribbon. The Graphics Format tab will appear when you insert something like an icon or a cartoon into your document. This tab gives you the tools to make adjustments to the icon that you inserted.
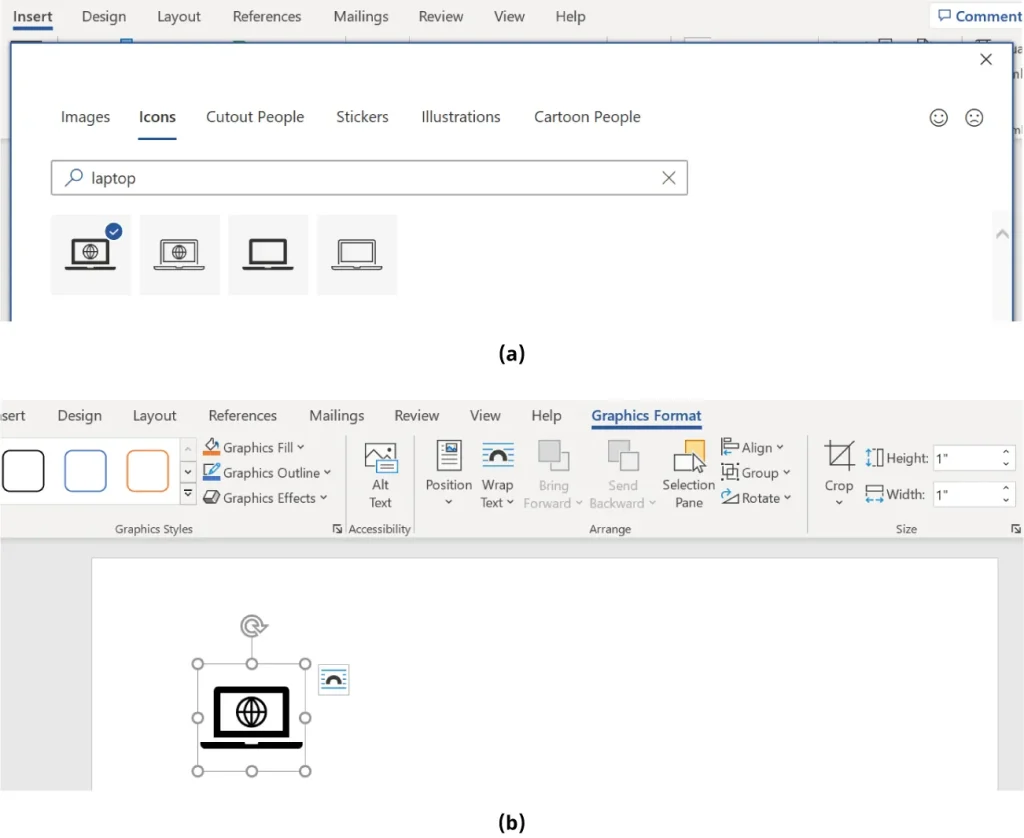
Figure 4.22 (a) Word gives you different categories to help you narrow down your search. (b) The Graphics Format tab offers tools for applying different styles, effects, and other features to your image. (Used with permission from Microsoft)
Now, let’s find a picture of a laptop from the internet. Choose Online Pictures and type “laptop” in the search bar. This will initiate a Bing web search for that key term. Notice that you can also search by license; here, we have chosen to search for images under the Creative Commons license only. To select an image, click on the picture and choose Insert (Figure 4.23).
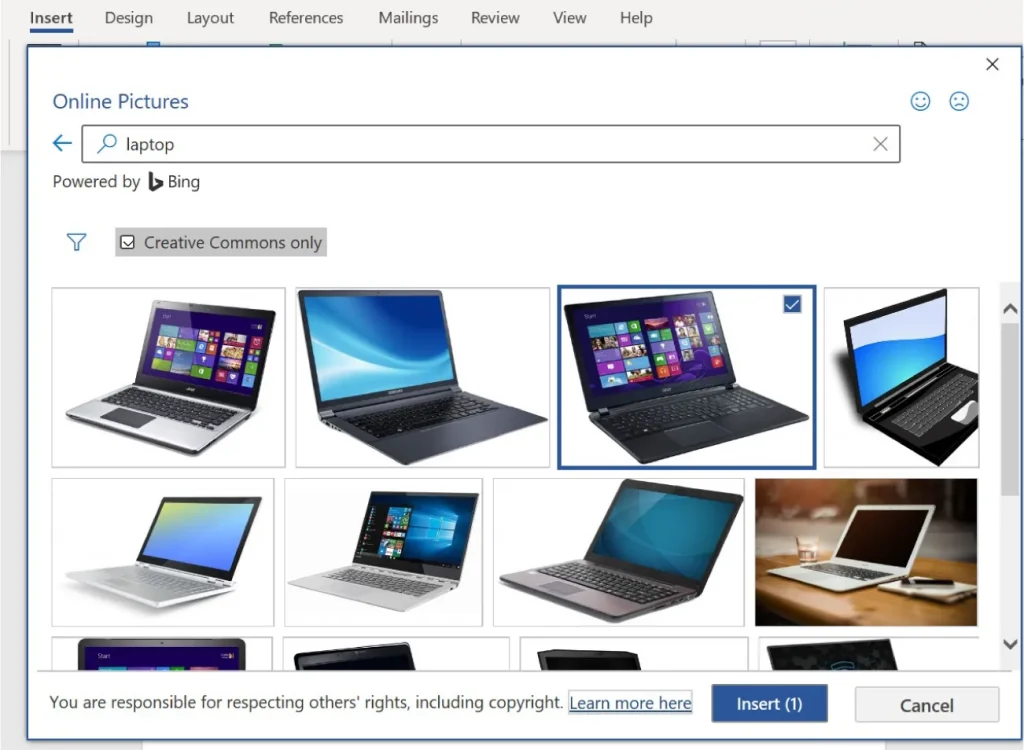
Figure 4.23 Bing is the search engine used for images because it is also a Microsoft product. (Used with permission from Microsoft)
In this case, because you are inserting an actual full-color image, such as a photograph, the tab added to the ribbon is the Picture Format tab, not the Graphics Format tab. As with the Graphics Format tab, this tab gives you the tools to make adjustments to the picture and its placement in the document, as Figure 4.24 shows.
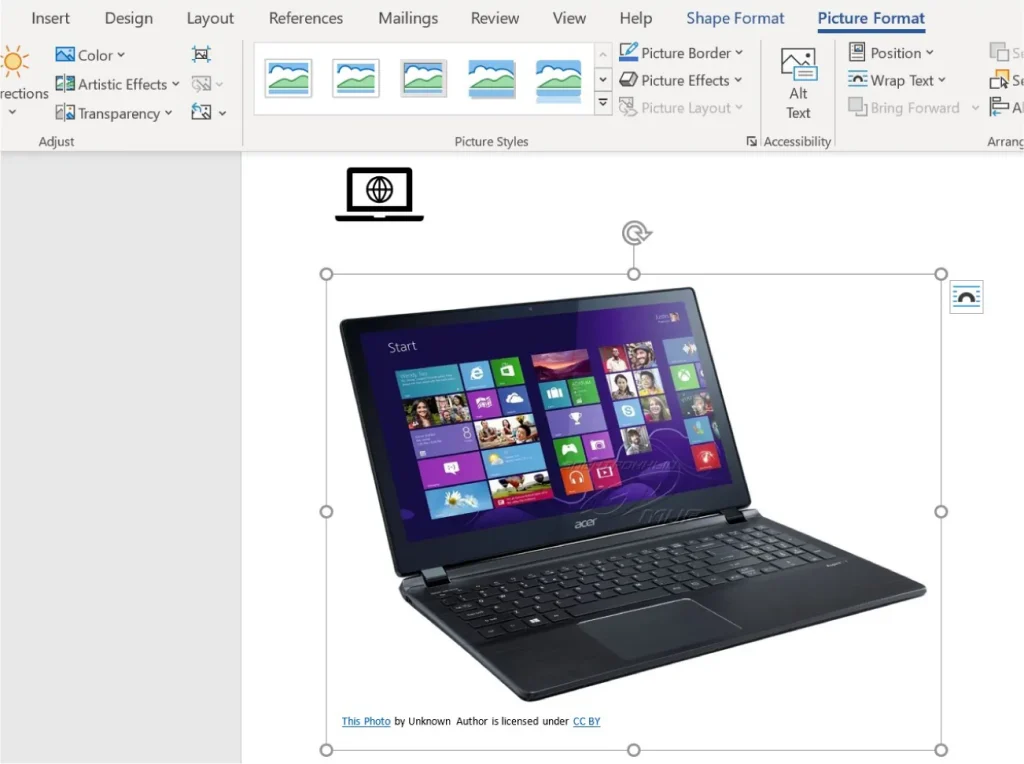
Figure 4.24 When images are used from the web, be sure to recognize copyrights and give credit for images when appropriate. Although this image is a stock photo with an unknown author, other photos you may use will show the author’s name and the photo’s license in the copyright line that Bing automatically generates. (Used with permission from Microsoft)
Shapes
The Shapes drop-down menu is a useful command if you are designing an ad, flyer, newsletter, or other graphic-heavy document. Shapes are graphical symbols, like arrows, rectangles, circles, and lines, that can be formatted in different ways. These can be useful in business documents because they can help call attention to certain topics or data without being as eye-catching as a photograph. For example, you might want to insert an arrow shape in the market trends report to draw attention to a specific item in a graph or chart. Or you might want to use a circle to outline a key part of a table. However, keep in mind the professionalism and visual appeal of the document you are preparing. Shapes might not be appropriate in all situations.
In Figure 4.25, you can see the wide range of shapes that you can add to your document. Let’s add an arrow to a table that we might use in the market trends report to highlight an important number in the table. This table contains television sales data for WorldCorp. We will revisit some of this data as we move through the spreadsheet chapters.
We want to point out the highest quantity sold in the table. To insert an arrow, go to the Insert tab, Illustrations command group, and select Shapes. Select the arrow you want to insert. In this example, the single line arrow (third over from the left) is selected, as shown in the figure. When you select the shape, you will get a black “+” as the cursor. Use that plus sign to insert the shape and to size the shape as you choose.
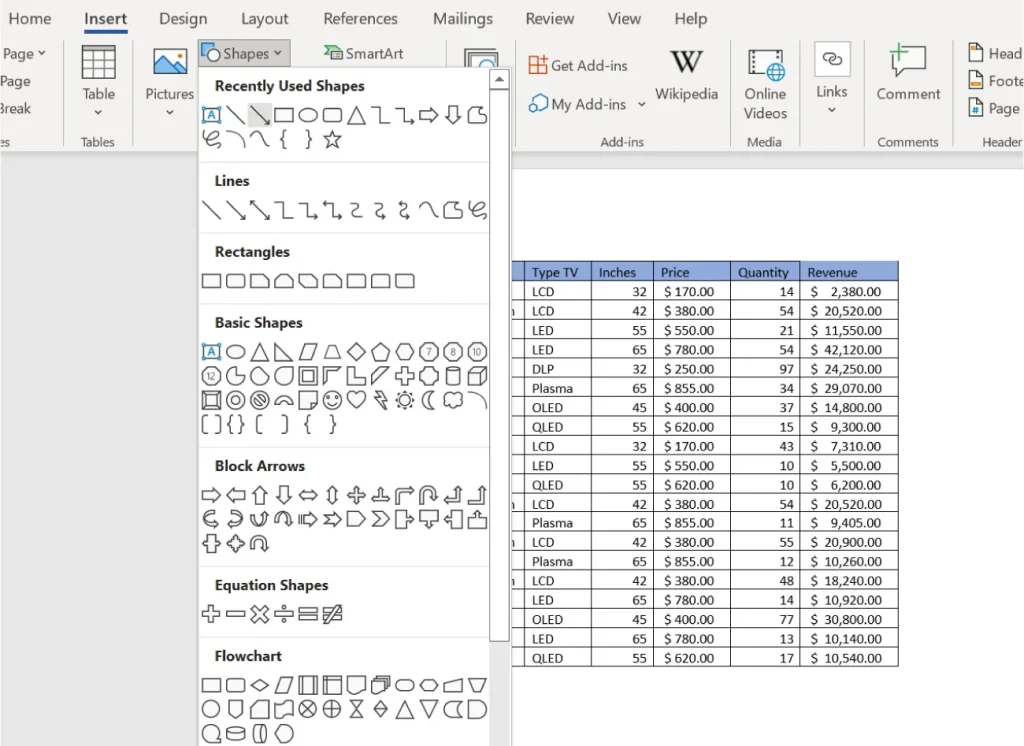
Figure 4.25 There are many shapes for adding emphasis and visual appeal to your documents. (Used with permission from Microsoft)
After you select and insert a shape, the Shape Format tab is added to the ribbon, as shown in Figure 4.26. You can change the color of the shape, add visual effects, align the object, use a word wrap, and change the position of the item.
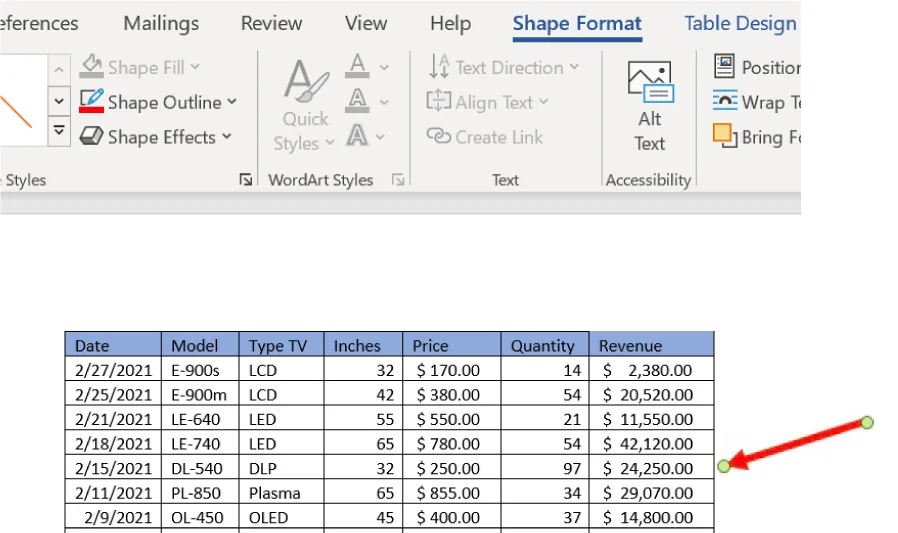
Figure 4.26 The Shape Format tab is used to change the color, size, and other features of the shape. (Used with permission from Microsoft)
SmartArt
SmartArt is a tool in Word that lets the user design organizational charts or flowcharts. It is also part of the Illustrations command group. It is similar to Shapes, but has the shapes prearranged in useful graphic formats, such as flowcharts. In Figure 4.27, you can see the different organizational graphs and charts available. This section covers three important types of SmartArt: Lists, Process Charts, and Hierarchy Charts.
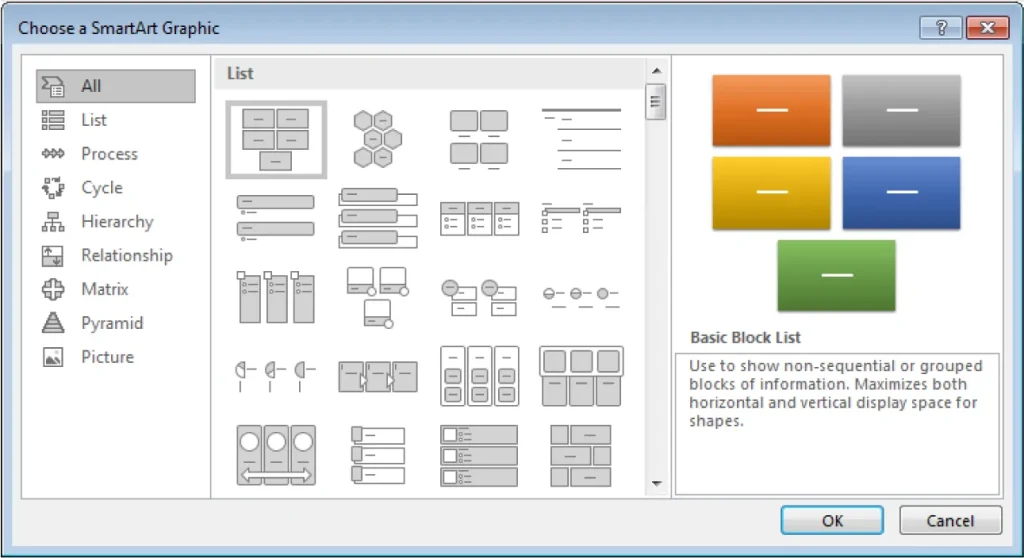
Figure 4.27 There are various business charts that you can design in SmartArt. (Used with permission from Microsoft)
SmartArt Lists
Microsoft Word: Advanced Formatting Features covered basic numbered and bulleted lists. But there are other, more visually complex options in SmartArt that an employee might have to use when creating documents that contain deeper levels of content than, say, a memo or introductory letter to a customer. SmartArt can also be used to outline an organizational structure to show reporting relationships between employees and managers.
To insert a SmartArt list, select the SmartArt icon from the Insert tab and click on the List menu to see all the options for Lists. Figure 4.28 shows a Horizontal Bullet List, which we can use to list the strengths and weaknesses of WorldCorp in the market trends report. Click OK to insert the SmartArt. As you insert it, the SmartArt Design tab is added to the ribbon, which has options for modifying the SmartArt. Figure 4.29 shows what a Horizontal Bullet List SmartArt looks like.
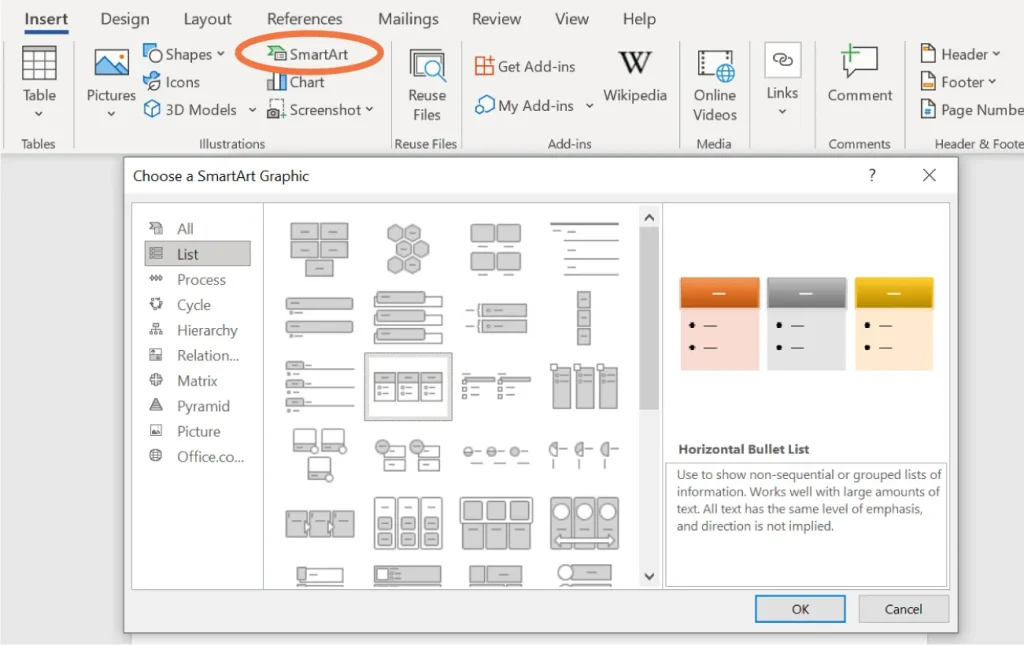
Figure 4.28 SmartArt also includes helpful hints on how to use each type of list best. (Used with permission from Microsoft)
![Screenshot of a Microsoft Word document with the "SmartArt Design" tab selected. The visible SmartArt graphic includes three vertically stacked rectangular boxes, each split into a blue top section with white placeholder text "[Text]" and a light blue bottom section with black bullet point placeholder text "[Text]". The toolbar above displays layout and color customization options for SmartArt graphics.](https://nicoletcollege.pressbooks.pub/app/uploads/sites/101/2025/07/4.29-1024x608.webp)
Figure 4.29 Using the text boxes, you can enter the relevant information into the SmartArt graphic. (Used with permission from Microsoft)
Process Charts
Another type of SmartArt is a process chart. This is one of the types of charts that Word offers to enhance documents and is commonly used in business. A process chart is a way of graphically representing a multistep process. Most business processes or workflows can be diagrammed; think about the many steps needed to publish a book or deliver a parcel. These process charts visually organize the steps or major components in a process so that everyone involved can understand what their role is in the workflow. Workers involved in the process may use process charts to check project status or determine which worker or department to consult to move a task along. For your market trends report, you might want to use a process chart to show the sequence of departments that the report will need to move through for approval.
Complex engineering, such as in manufacturing plants, has numerous processes happening at the same time, with each set of processes being dependent on another set. The charts offered in the Process option can help encapsulate the different types of workflows in a company.
In Figure 4.30, you can see a flowchart that needs to be filled. As with the Horizontal Bullet List, the boxes are empty when the SmartArt is initially inserted. To add text, simply click on the text brackets and enter the desired information. Notice there is a line that connects each box to the next one in a down than up pattern, indicating the flow sequence.
![Screenshot of a Microsoft Word document with the "Design" tab selected, displaying a SmartArt graphic. The graphic features nine blue rectangular boxes labeled "[Text]" arranged in a hierarchical structure with connecting lines. The toolbar above includes options for editing the SmartArt, such as promoting or demoting elements, changing layout, and adjusting colors.](https://nicoletcollege.pressbooks.pub/app/uploads/sites/101/2025/07/4.30-1024x644.webp)
Figure 4.30 This type of SmartArt is called a Vertical Bending Process chart. It can be used to show many different steps in a linear workflow, without taking up too much space on the page. (Used with permission from Microsoft)
Link to Learning
Check out this tutorial to learn about creating flowcharts in detail. This site provides basic terminology and a step-by-step walk-through on how to create a simple flowchart using the Shapes commands and a more complicated flowchart using the SmartArt commands.
Now let’s add a process chart to the market trends report. Open a blank document and go to the Insert tab, SmartArt, and click Process. Choose the first option, Basic Process, and click OK (Figure 4.31). You can also change the colors using the tools on the SmartArt Design tab using the change colors palette on the tab (Figure 4.32).
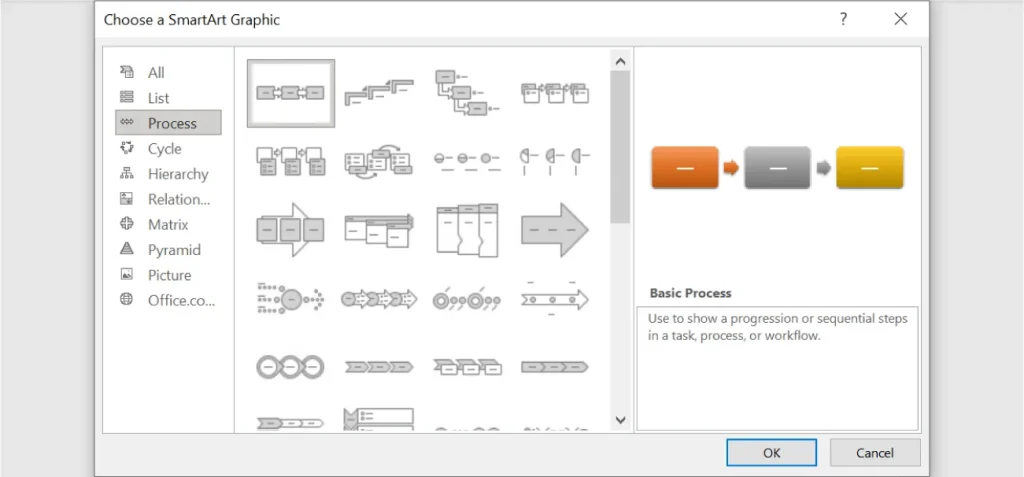
Figure 4.31 Becoming familiar with a Basic Process chart will lay the foundation for progressing to more complex charts in SmartArt that you might need later in the workplace. (Used with permission from Microsoft)
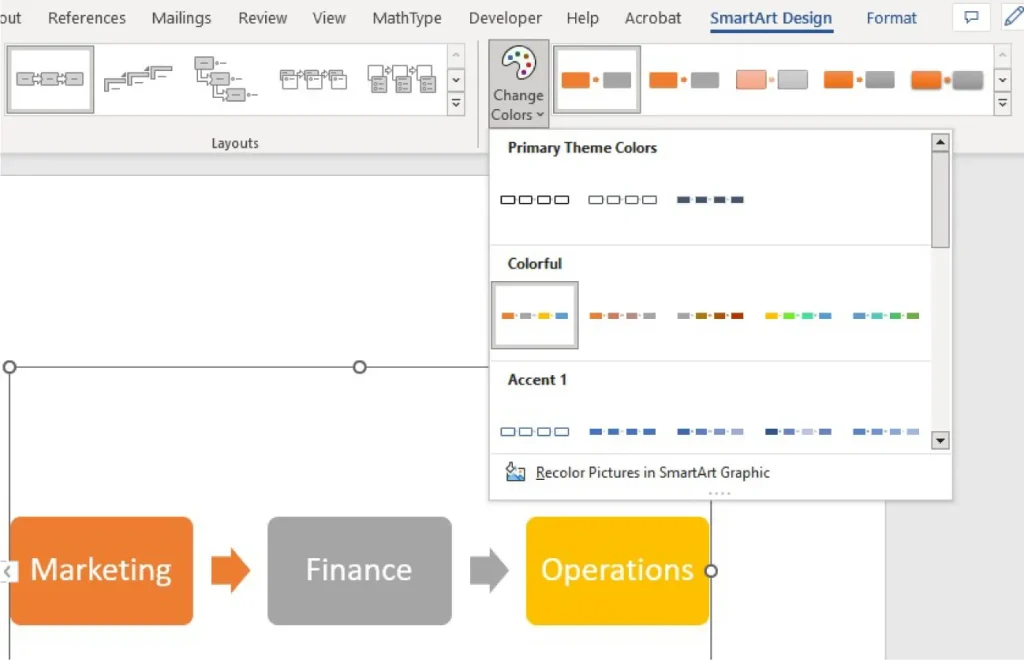
Figure 4.32 The default color scheme is blue and white when the process chart is inserted, but there are many color options to make the process chart look more professional and visually appealing. (Used with permission from Microsoft)
Hierarchy Charts
Another chart often used in corporate settings is the hierarchy chart. These charts typically show the chain of command at a business; in other words, who supervises whom. In a large corporation like WorldCorp, there may be hundreds of hierarchy charts. Every manufacturing center may have dozens, one for each functional department. You could consult these hierarchy charts in a company organizational manual, or online, on the company’s intranet. In Figure 4.33, you can see the inserted hierarchy chart of WorldCorp’s marketing department.
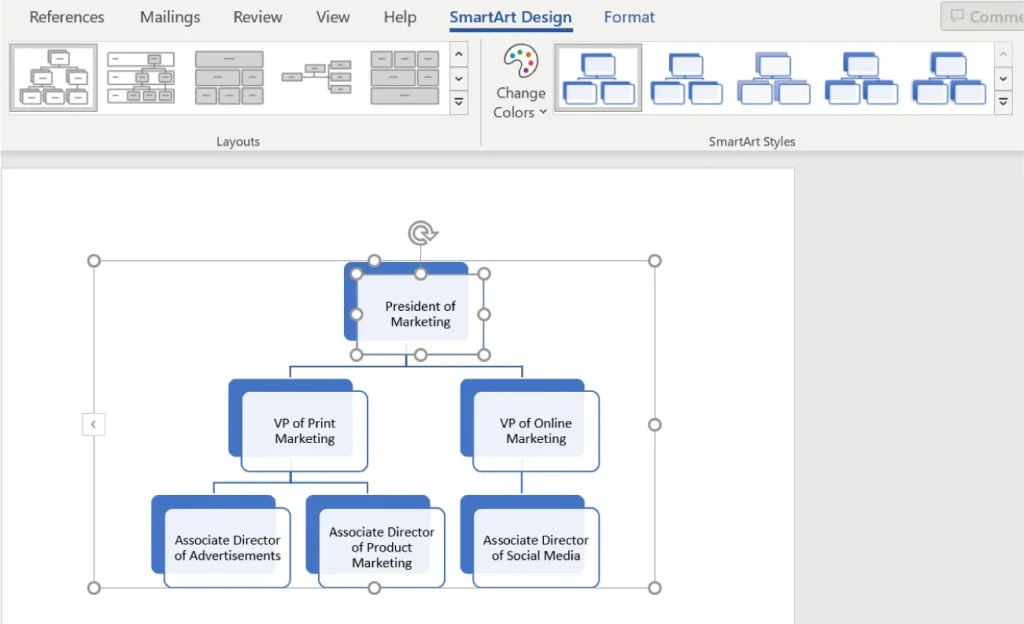
Figure 4.33 You can see the chart formatting and design options on the ribbon on this hierarchy chart. (Used with permission from Microsoft)
Real-World Application
Understanding Types of Organizational Charts
Many companies will include an organizational chart (“org chart” for short) within their internal documentation provided to employees. These serve as important documents that visualize the structure of the company, as well as the chain of command within its service units. Hierarchy charts can help you construct an organizational chart quickly. Before you begin, you will want to identify the type of organizational structure your company has adopted.
Hierarchical organizations will have a clear and linear chain of command, usually organized by product or function, with power primarily held at the top. These are mechanistic, or bureaucratic, organizations. They tend to be formal, with a narrow span of control within each unit. Organic structures are more fluid and flexible. Matrix organizations are a great way to try out a more organic organizational structure, while still maintaining some aspects of a mechanistic structure. In a matrix, employees may report to more than one reporting line and therefore power (and responsibility) is distributed. Dotted lines in such a chart would show informal or secondary relationships. So, before embarking on creating an organizational chart for an organization, first understand its structure to select the most appropriate chart type.
Charts
Charts are another type of visual representation available in Word. While tables present just data, and SmartArt figures show relationships, charts can show both. Word charts include many types of charts that are likely familiar to you, such as bar charts, line graphs, and pie charts. Charts can use data from another source, such as a Microsoft Excel spreadsheet, to create the visual representation.
You can create charts in Word using the tool in the Illustrations command group. You will use some of the data from the sales data in Figure 4.25 and Figure 4.26 to create a bar chart of the quantity sold for each product. When you finish inputting the data, you will see the chart in your document (Figure 4.35). First, select the Chart command in the Illustrations command group, and choose the type of chart that you want to design. Let’s choose a bar chart, also known as a Clustered Column chart (Figure 4.34). As you select OK, Word will immediately open an Excel window so that you can enter the data. When you finish inputting the data, you will see the chart in your document. As with the other types of graphical representations that we’ve covered, once you click on the chart, a new tab will appear in the ribbon. Click on the chart and you can further format the chart using the Chart Format tab that appears. You can also edit the data in the chart or table using the Edit Data tool on the Chart Format tab, as shown in Figure 4.36. You can choose to edit the data in Word. If you choose this option, an Excel window will open in Word with the data used to build the chart. If you would like to save the data as an Excel file, choose Edit Data in Excel. This will open the Excel application. Here, you can edit the data, but also save the information as an Excel file.
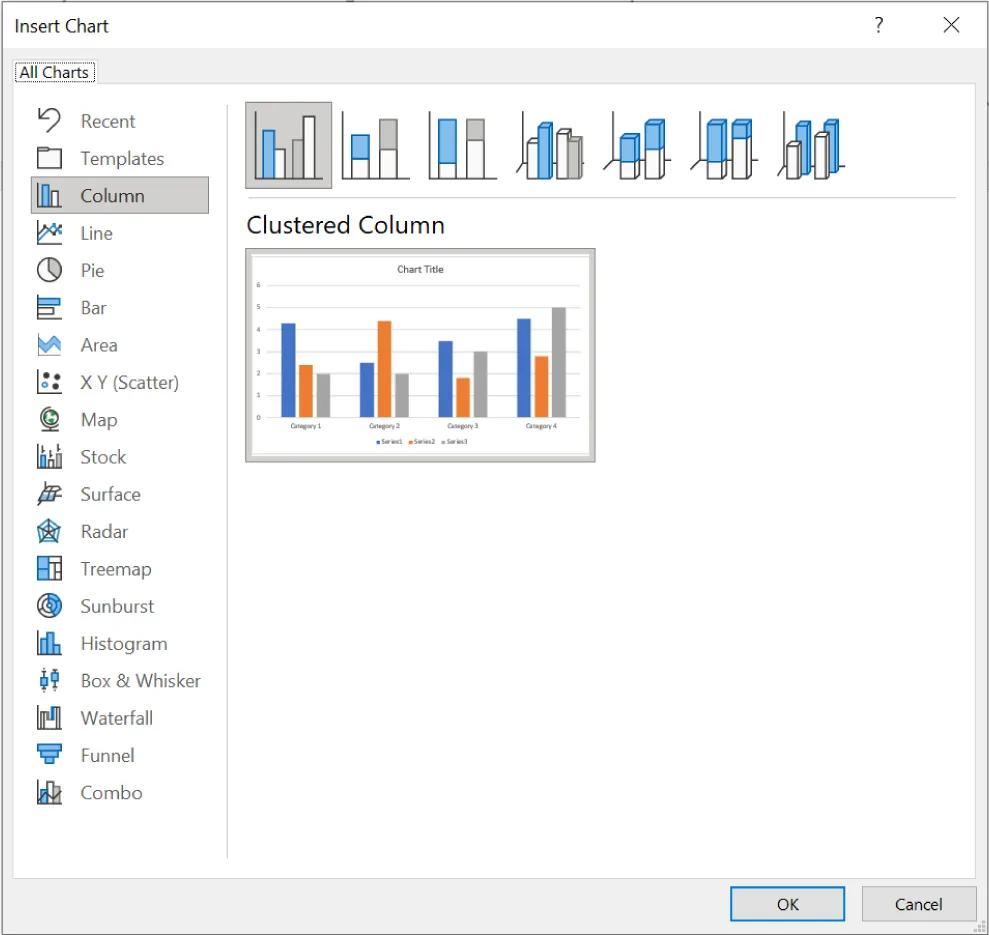
Figure 4.34 Within each chart type, there are many further options for customization. (Used with permission from Microsoft)
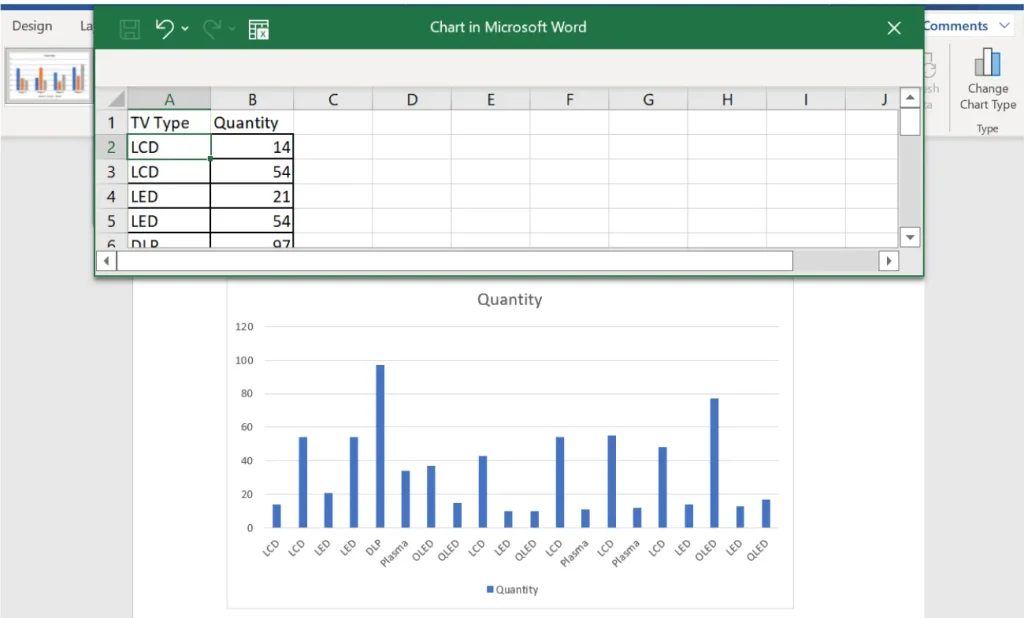
Figure 4.35 As you create a chart, Word will create a new Excel file embedded in the document. You can choose to open the data in Excel using the Edit data tool. (Used with permission from Microsoft)
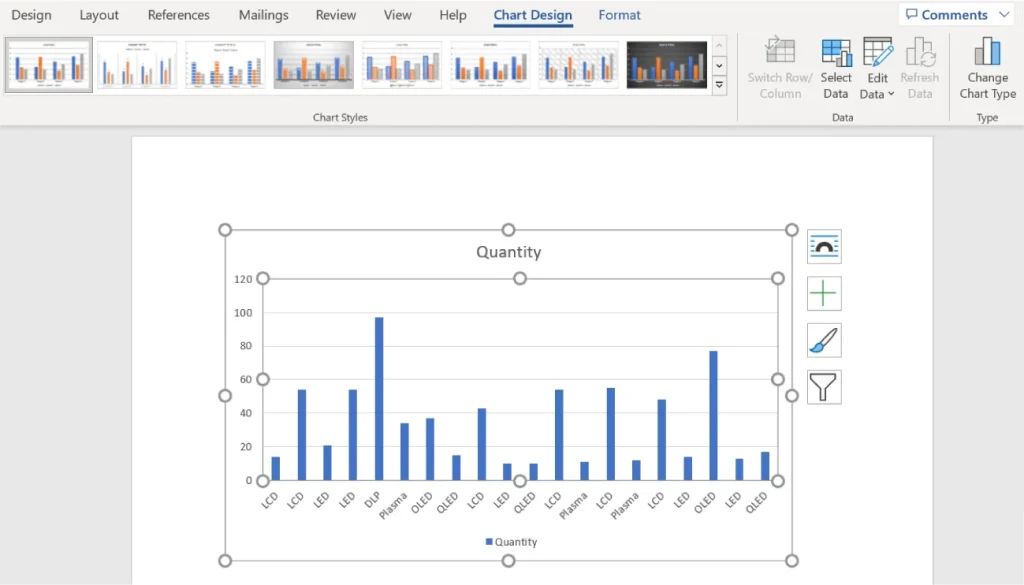
Figure 4.36 You can change the design and type of chart using the Chart Format tab. (Used with permission from Microsoft)
It is worth noting that when you are looking to design a chart, typically you can use Excel as a starting point for creating your chart. This is often a much easier approach than starting your chart in Word; this process is covered in Working with Spreadsheets. After creating the chart in Excel, you would then copy and paste the chart from Excel into Word or import the file into Word.
Text Command Group
Like the Illustrations command group, the Text command group is located on the Insert tab. It houses the Text Box, Quick Parts, WordArt, Drop Cap, Signature Line, Date & Time, and Object commands. These commands are all related in their functionality, as they are tools to insert autogenerated text or specially designed text.
Text Box
You may have seen a text box, either in a Word document, on a website, or in a print article. It is simply a self-contained square with some text inside. Figure 4.37 shows text box options. The text box is often used in highly graphical documents, such as an email ad, but you may also add a text box for inserting a meaningful phrase, idea, or data that you want to stand out from the rest of your document. The advantage of a text box is that you can format the rest of the text in your document to wrap around it in different ways, which you will learn about later in this chapter. In essence, it treats a box of text as if it were an image.
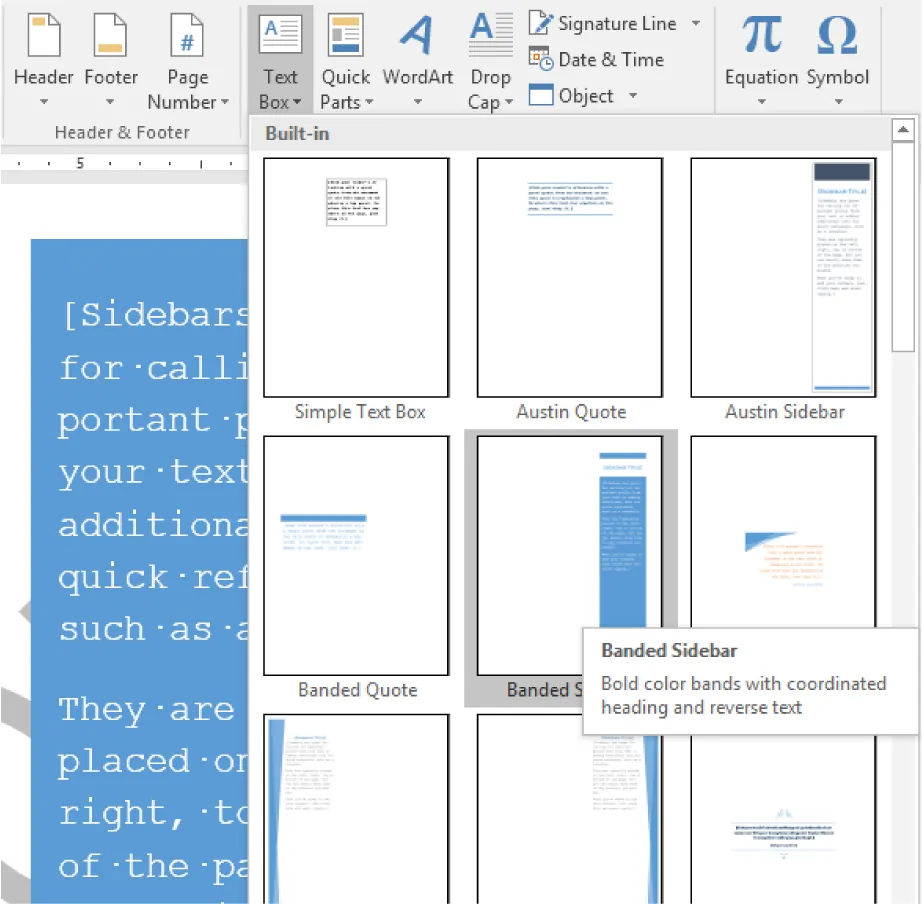
Figure 4.37 Text boxes such as this Banded Sidebar can help make your report more visually appealing and easy to read. (Used with permission from Microsoft)
Quick Parts
The Quick Parts command in the Text command group was also part of the Header & Footer tab that you get when you insert a header or footer. This is an alternative path to quickly add information to the document. Through this menu, you can add a number of items to your document. The first option, AutoText, will automatically add either the author’s initials or name to the header of the document. Another option under Quick Parts is to add additional information such as the company mailing address (as shown in Figure 4.38). The Fields option adds fields for a more specialized feature of Word called Mail Merge, which will be covered in the Advanced Document Preparation chapter. This information will only be added if this information was added to the document properties, as you learned in Essentials of Software Applications for Business.
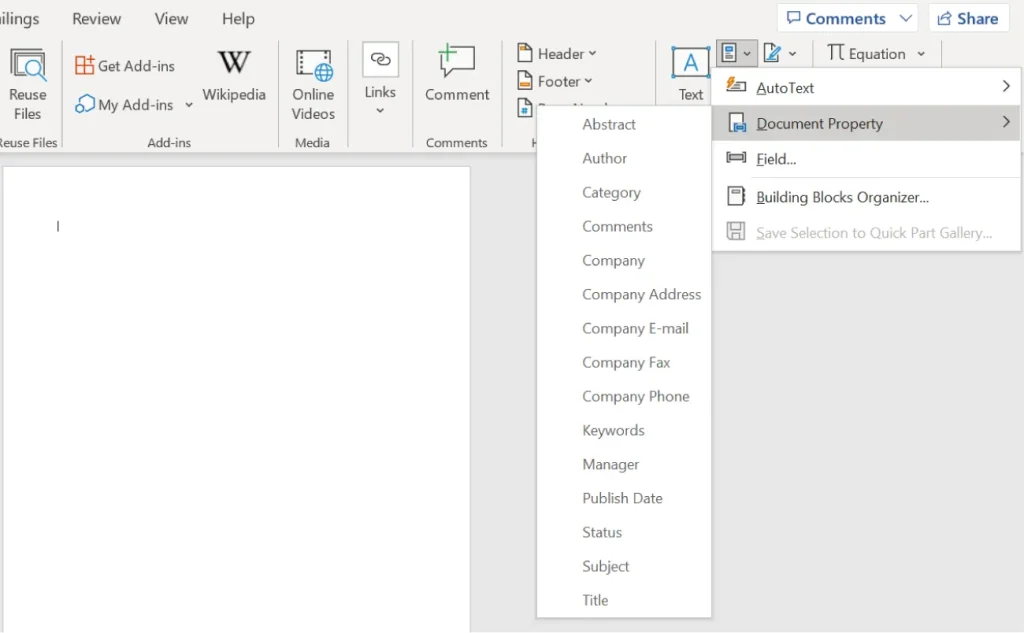
Figure 4.38 Key company information, such as address, email, and phone number, can also be added through the Quick Parts tool. (Used with permission from Microsoft)
WordArt
WordArt is a type of stylized font available in Word. WordArt can be used to add colors, shadows, or borders to text. In can also be used to change the text to be vertical or even diagonal. While it is appropriate to use in graphic-heavy formats, such as front pages of business reports, newsletters, or brochures, it is not appropriate for more text-heavy or professional documents, such as business correspondences, the inside of a business report, a résumé, or a cover letter. That said, using WordArt in your document can be a fun way to experiment and add color and creativity to it. WordArt could also be used to start the creation process for a logo, although many businesses will use a graphic design company to create corporate logos.
Let’s practice with the company name, WorldCorp, to get an idea of what WordArt can do for plain text. To insert WordArt, select the WordArt icon from the Text command group Figure 4.39. Choose a style, and a box with “Your text here” will appear on the page, as shown in Figure 4.40. The ribbon will change to add a Shape Format tab, where you can change the color, the font effects, and the position of the WordArt object. Replace the text in the box with “WorldCorp” and choose a design that incorporates blue as the color because this is the company’s primary color. Changes are made using the options in the WordArt Styles command group. You may place the WordArt object behind or in front of other objects, or align it in a certain position within the document, as you would with an image.
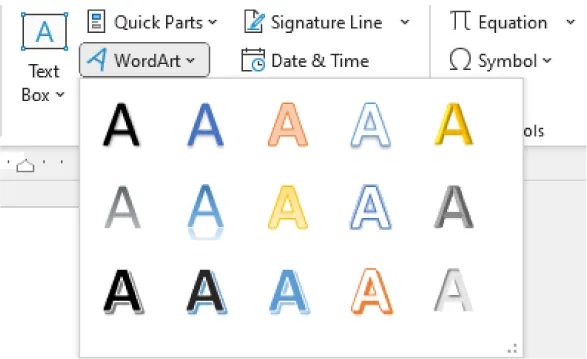
Figure 4.39 Whatever you type in the WordArt box will initially be center aligned. You can change text alignment by going to the Paragraph command group under the Home tab. (Used with permission from Microsoft)
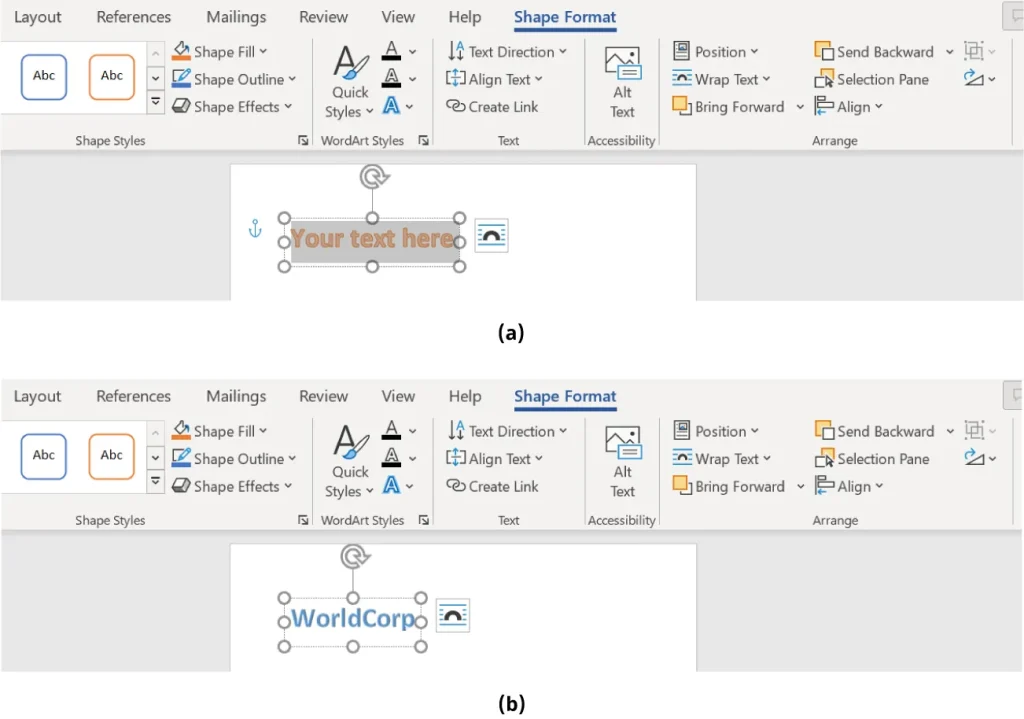
Figure 4.40 (a) When you insert WordArt, you will get another tab on the ribbon to further customize the text. (b) You can send the WordArt forward or backward using the Arrange command group. (Used with permission from Microsoft)
Drop Cap, Signature Line, Date & Time
The formatting options in the Text command group can be seen in books, reports, and other kinds of stylized texts. For instance, you have probably seen a drop cap in a novel or journal article: It’s when the first letter of the first sentence is large or in a stylish font, and the rest of the text is wrapped around it. To achieve this effect, select the first letter and choose the Drop Cap drop-down menu from the Text command group (Figure 4.41). Once there, you will see options for font style and placement. You can choose Drop Cap Options to change the font type and size. Generally, drop cap is not used in professional documents such as the market trends report. We are just using it here for illustrative purposes. As you can see from the figure, the large letter T is a bit distracting in the report.
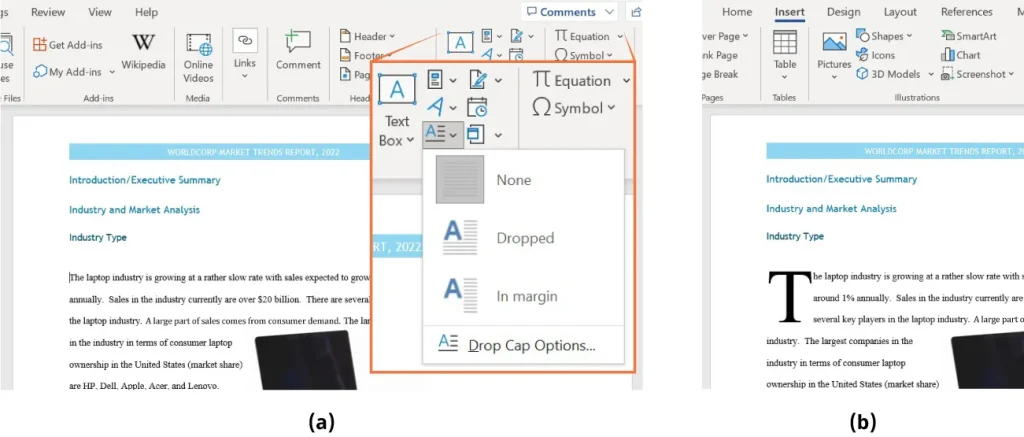
Figure 4.41 (a) You can choose from among a few different drop cap styles. (b) The drop cap design is a decorative style that you might have seen at the start of a novel or magazine editorial. (Used with permission from Microsoft)
You have probably seen a signature line in many emails and letters in Word. The signature line is an autogenerated graphical object that has your name, job title, and email address, as Figure 4.42 shows.
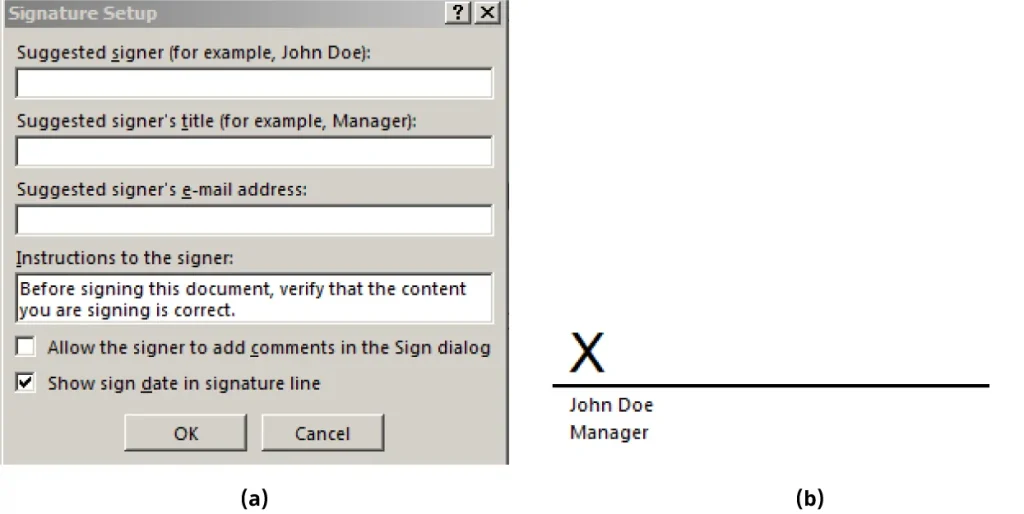
Figure 4.42 The signature line on (b) is what you will see once you fill the dialog box in (a). (Used with permission from Microsoft)
The Date & Time command is an autogenerated time stamp of the date or/and time format of your choosing, as Figure 4.43 shows. You might want to include the date and time stamp to your market trends report as it moves through the development process. This can help you keep track of the edits that are made in the document at various stages of writing or through the different departments at WorldCorp that will contribute to the report. You could include this information as a header or footer in your document. Note that if you use the Date & Time command, it will update to the current date and time, even if you did not make any changes to the document.
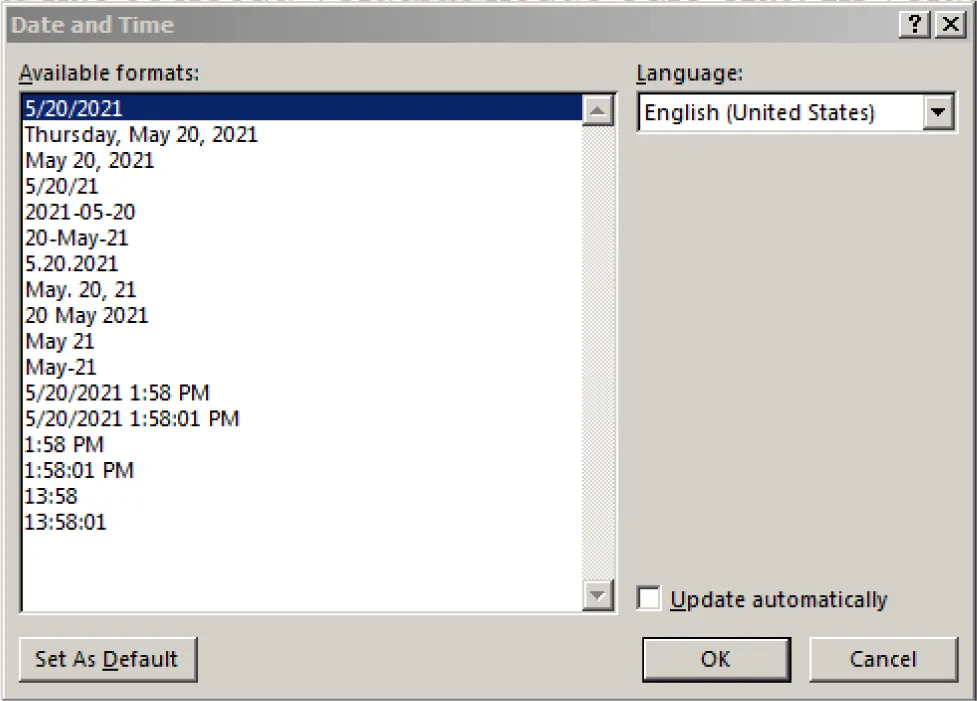
Figure 4.43 You can choose among different date and time formats, depending on the style of your company and what kind of information you want captured. (Used with permission from Microsoft)
Inserting an Object
The final item in the Text command group is Object. An object is anything that is inserted into the document rather than simply typing text. An object can be a wide variety of things, including graphics (WordArt), images, charts and graphs from Excel, links to a web page, files from a program such as Adobe Reader, among others. When you insert an object, Word will create a link to the object and you will be directed to this object when you click on it; it will open in a separate window. This action might be helpful if you want to direct someone to a file, such as an Excel spreadsheet, without having to actually include all the information in the Word document.
You can also insert an object that links to an outside source, such as a web page. The Object tool can also take text from another file and place that in the current document. This can help you save some time, instead of copying and pasting information from one document to the next. You might consider using this feature for the market trends report because you will have different departments working on different sections of the report.
To insert an object, go to the Object tool in the Text command group on the Insert tab. There are two options in the tool: Object and Text from File, as shown in Figure 4.44. When Object is chosen, a dialog box appears, in which you can select all sorts of file formats if you were to Create New, or Create from File. Create New means that you will create the file within the Word document in the chosen format such as Excel or Adobe. You could also choose to have the link to the object as an icon in your document rather than the first page of the inserted object being displayed. Create from File means that you can use an existing file to insert into the document. The Integrating Applications chapter covers inserting objects in more depth, as it includes the integration of Office programs.
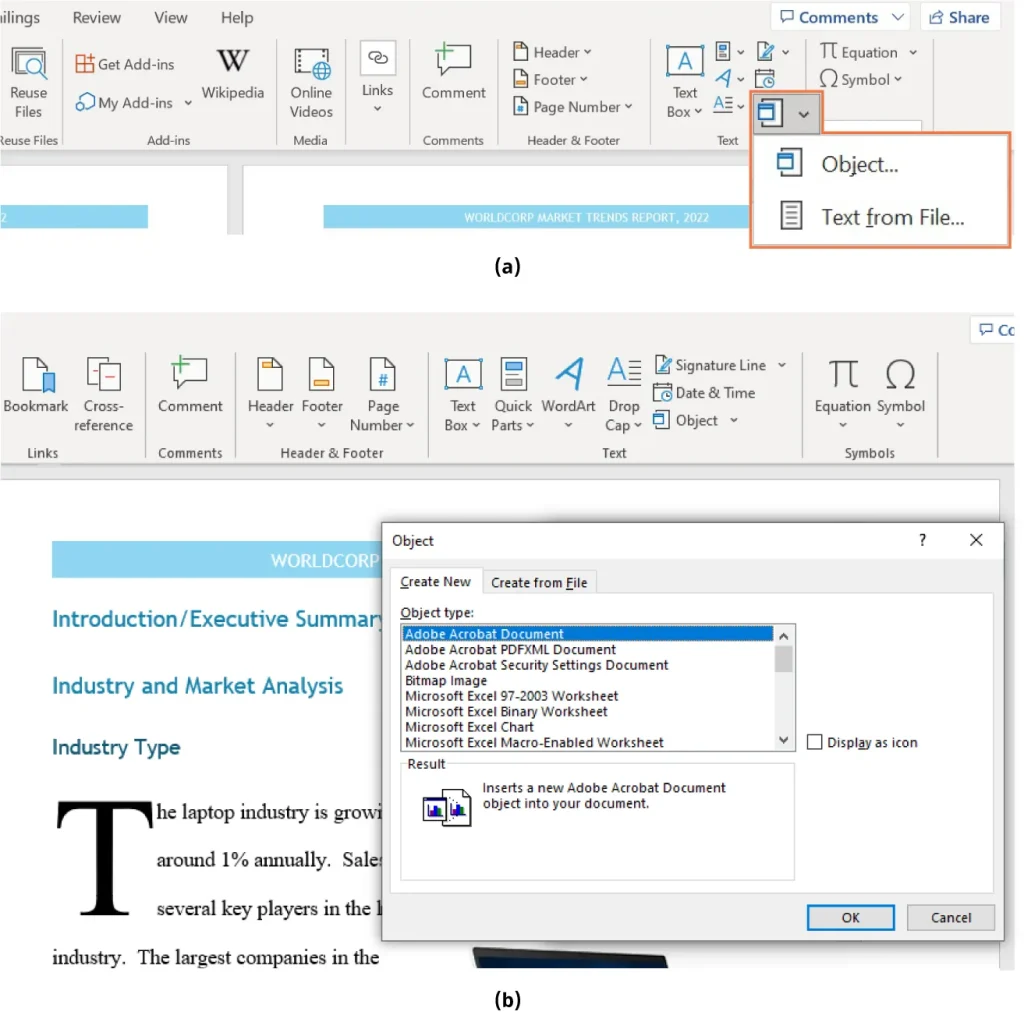
Figure 4.44 (a) You can insert an object or use text from another file in your document. (b) When you choose Object, you can create a new object or use an existing file. (Used with permission from Microsoft)
Symbols Command Group
The Symbols command group is also part of the Insert tab. A symbol is a special character not found on most keyboards, and includes characters such as currency symbols, en dashes and em dashes, arrows, Greek letters (often used in economic or financial math), and many other characters. Figure 4.45 shows some of the character choices available in Word.
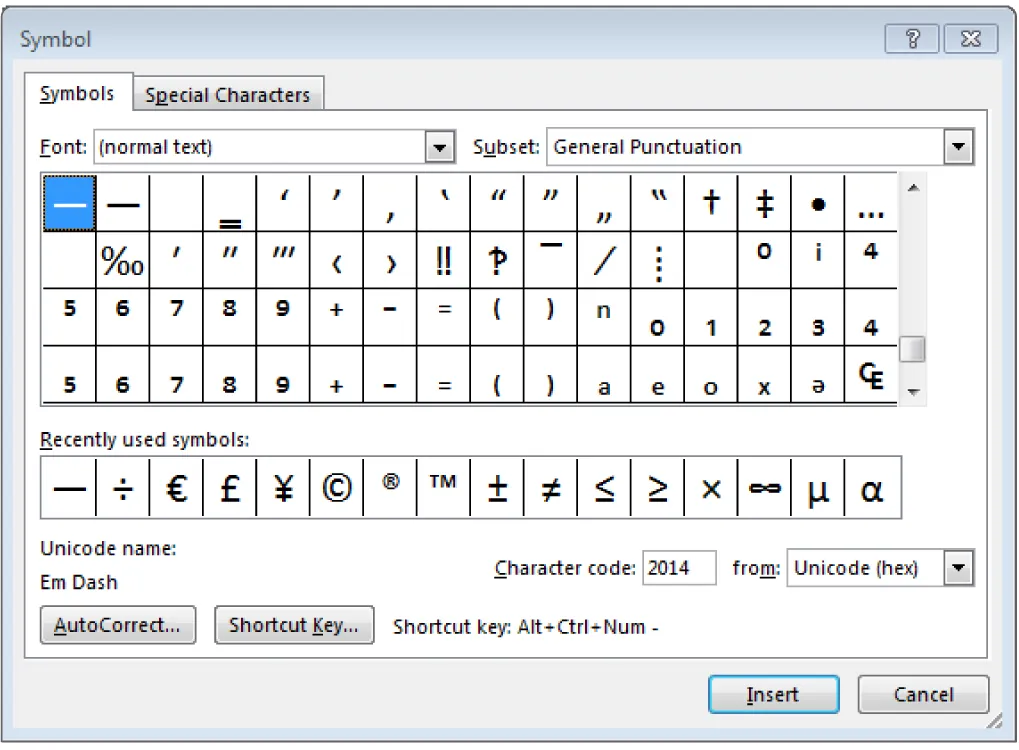
Figure 4.45 You can use the Subset combo box to look for the category you are looking for, to help narrow down your choices. (Used with permission from Microsoft)
The Equation command is for inserting mathematical equations into the document. The drop-down arrow by the Equation tool allows you to see some built-in equations from common calculations, as Figure 4.46 shows.
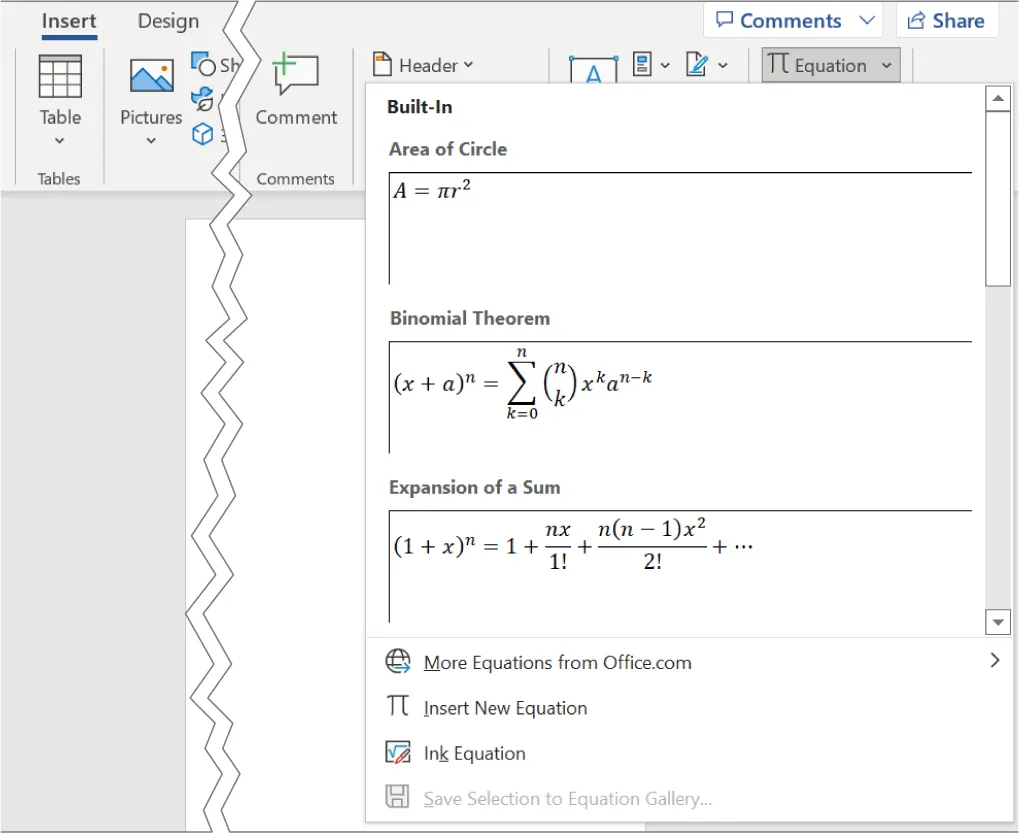
Figure 4.46 Several built-in equations are available in the Equation tool. (Used with permission from Microsoft)
You can also choose to insert a new equation if none of the built-in options meet your needs. When you insert the equation (either new or built-in), a new tab appears on the ribbon called Equation. Here, you can choose the math notation of your choice and build your own equations. This is especially useful for economic and finance research, engineering reports, or any other kind of quantitative discipline or science. You can even draw the equation that you want to insert, and Word will recognize the numbers and symbols. Select Ink Equation from the Equation drop-down menu. This allows you to use the mouse or your finger to draw the equation symbols if your touch screen or pad allows this (Figure 4.47).
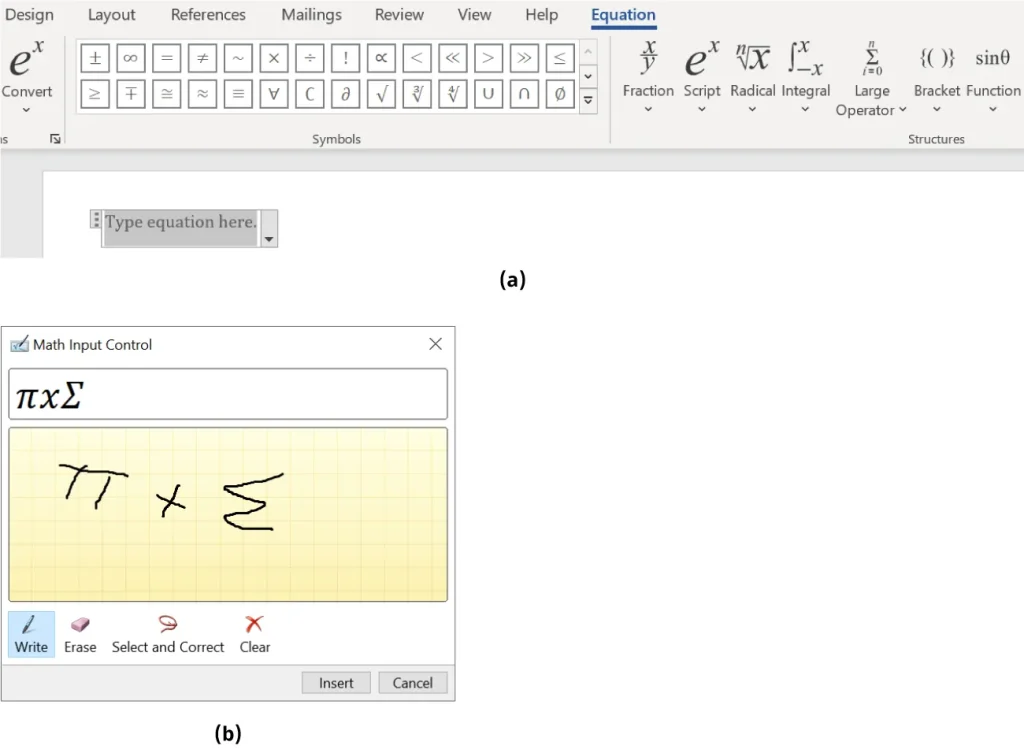
Figure 4.47 (a) The Equation tool can be helpful in making your documents look professional when you need to incorporate mathematical equations. (b) Word has the ability to read your drawings and recognize the symbols. (Used with permission from Microsoft)
Media Attributions
- 4.17
- 4.18
- 4.19
- 4.20
- 4.21
- 4.22
- 4.23
- 4.24
- 4.25
- 4.26
- 4.27
- 4.28
- 4.29
- 4.30
- 4.31
- 4.32
- 4.33
- 4.34
- 4.35
- 4.36
- 4.37
- 4.38
- 4.39
- 4.40
- 4.41
- 4.42
- 4.43
- 4.44
- 4.45
- 4.46
- 4.47
